
Solana is trying to hold rising support as buyers push toward the $95 and $98 resistance zone. A stronger recovery needs a weekly move above $124, while a drop below $83 could send $SOL back toward deeper support.
Solana is trying to recover from rising support on the short-term chart, with $95 and $98 now acting as the first major tests for buyers. A stronger move needs a weekly reclaim of $124, while a loss of $83 would put deeper support near $60 back in focus.
Solana Holds Rising Support as $98 Target Comes Back Into View
Solana is bouncing from a rising trendline on the 8-hour chart, while the chart shared by Satoshi Flipper points to $98 as the next major resistance. The setup shows $SOL holding a higher support structure after its latest pullback.
The price recently tested the trendline and reacted from that area. This keeps the short-term bullish structure active, as long as $SOL stays above the rising support.
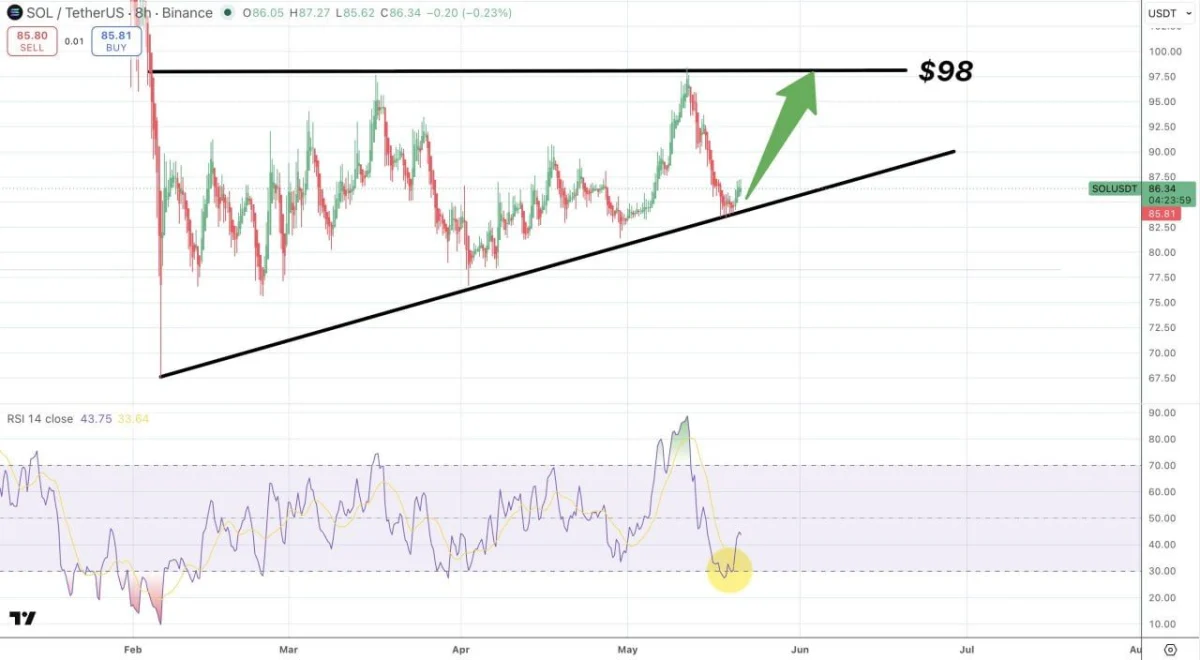
$SOL 8H Trendline Chart. Source: Satoshi Flipper on X
The RSI also bounced from the lower zone near 30, which shows selling pressure started to cool. That supports the idea of a recovery attempt, but $SOL still needs follow-through.
The main upside level is the black horizontal resistance near $98. A clean move toward that zone would confirm that buyers are still defending the trend.
If $SOL loses the rising trendline, the setup weakens. In that case, the next support area sits around $80 to $82, where price previously found demand.
Solana Faces $95 Test as Weekly EMA 50 Blocks Recovery
Solana is trying to rebound from the lower weekly range after dropping sharply from the $295 high area. The chart shared by Dami Defi shows $SOL trading below the former support zone near $95, while the weekly EMA 50 at $124 remains the main recovery level.
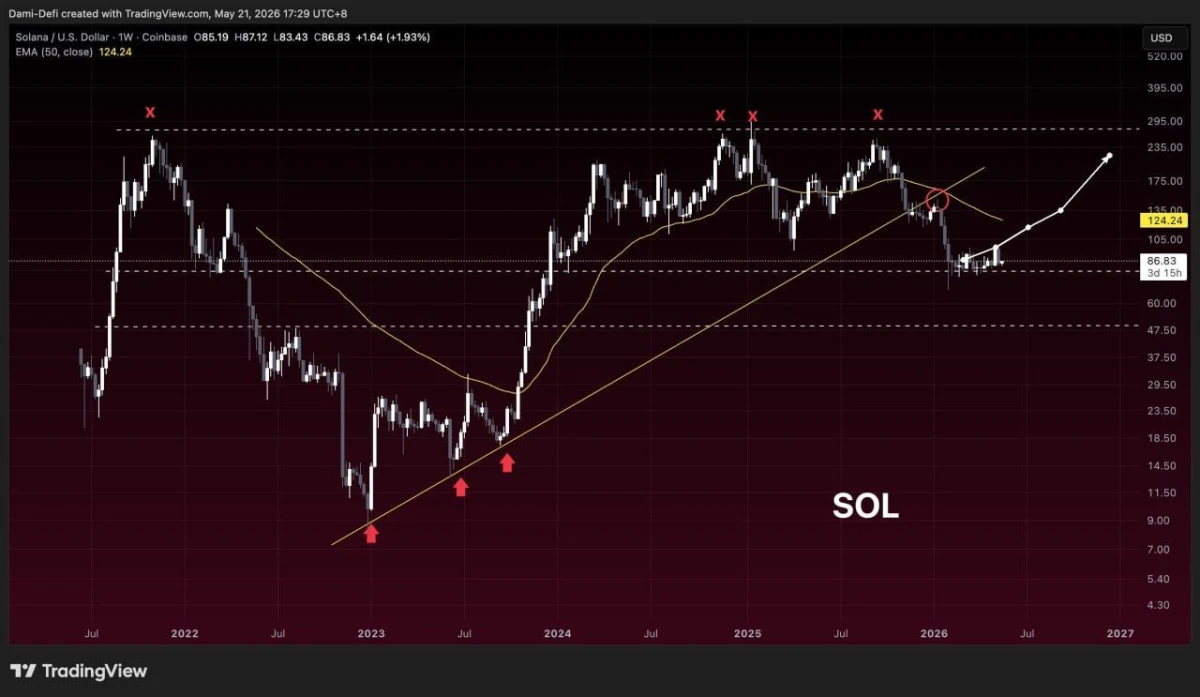
$SOL Weekly EMA 50 Chart. Source: Dami Defi on X
The first test is the $95 area. A move back above that zone would show that buyers are trying to reclaim lost support. However, that alone would not confirm a full trend shift.
The bigger level is $124, where the weekly EMA 50 now sits. $SOL lost that level earlier this year, and the chart marks that breakdown with a red circle. Until $SOL closes back above the EMA 50 on the weekly chart, the recovery remains limited.
If $SOL reclaims $124, the chart points toward the next major resistance zone between $175 and $200. That area would become the main upside target after a confirmed weekly breakout.
If $SOL loses $83 on a weekly close, the setup weakens again. In that case, the rising trendline near $60 becomes the next major downside level.