
$XRP is down by less than 1% in the last 24 hours and now trades at $1.36.
The bulls could lose the $1.32 support level in the near term as the bearish price action gets stronger.
Momentum indicators are still bearish, adding further pressure to $XRP.
ETF inflows continue to surge higher
$XRP has been underperforming over the past few days despite the massive ETF inflows recorded.
According to CoinGlass’s ETF page, $XRP ETFs recorded an inflow of $8.7 million on Thursday, up from the $1.4 million recorded the previous day.
Yesterday’s data means that the funds saw inflow for six consecutive days.
However, the ETF inflow is yet to reflect in $XRP’s price as the coin is down by 7% in the last seven days.
While institutional demand is growing, retail demand continues to decline.
The derivatives data shows that $XRP’s futures Open Interest now stands at $2.9 billion.
The long-to-short ratio reads 0.9135, indicating that the shorts are paying the longs. The ratio staying below one means that the bears are currently in control of the market.
Meanwhile, the $XRP OI-Weighted Funding Rate flipped positive on Thursday and now reads 0.0054%. The positive rate suggests that buyers are starting to open new positions in the market.
Finally, on-chain activity on $XRP Ledger (XRPL) has increased since the start of the week.
According to Santiment, the number of active addresses on XRPL has surged since the start of the week and is now approaching 24,000.
An increase in this metric suggests growing user engagement and speculative interest. Usually, investor confidence increases when on-chain activity shows growing user engagement.
Ripple price forecast: $XRP still consolidating above $1.32
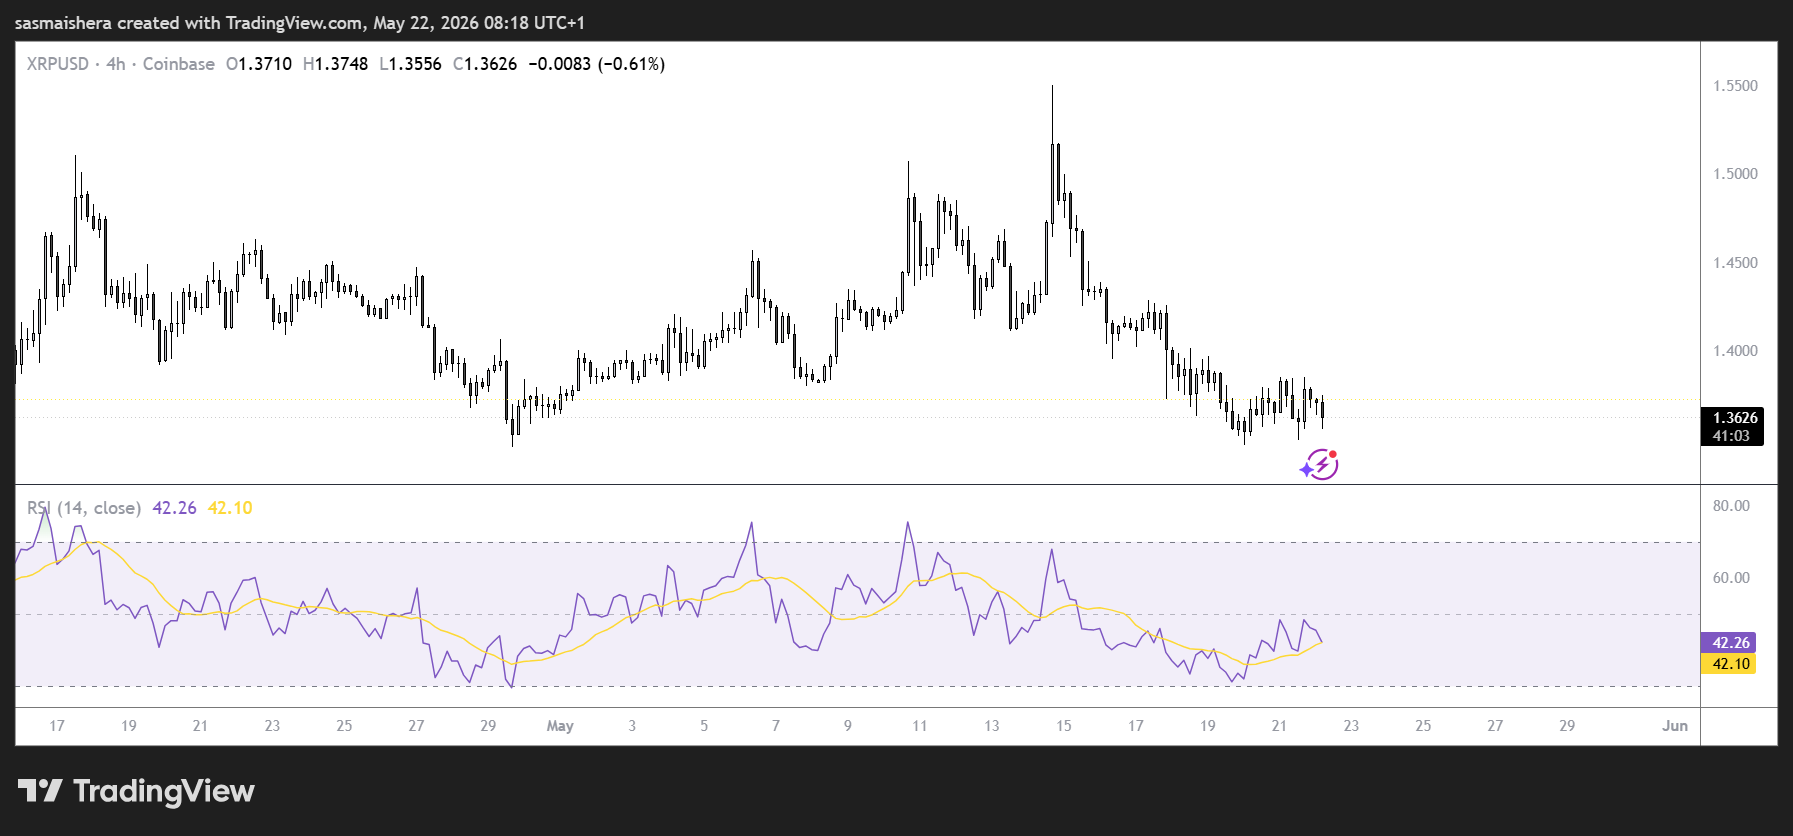
The $XRP/USD 4-hour chart is still bearish as $XRP is down 1% and now trades around $1.36 per coin.
The bearish trend is kept in check by $XRP’s struggle to surpass the 50-day EMA at $1.41. The momentum indicators also support a bearish outlook in the near term.
The Relative Strength Index (RSI) is hovering near 43, while the Moving Average Convergence Divergence (MACD) histogram is in negative territory, hinting that the sellers might continue to dominate.
If the bulls regain control, they would encounter immediate resistance just around the 50-day EMA at $1.41.
The buyers would need to close the daily candle above this resistance if they stand a chance to push $XRP higher towards the $1.50 psychological level.
An extended rally could enable $XRP to reclaim the $1.70 resistance and break the bearish trend.
However, if the selling pressure persists, $XRP may retest the support at $1.32. A deeper pullback below this level would expose demand zones below $1.30.