cryptopotato.com
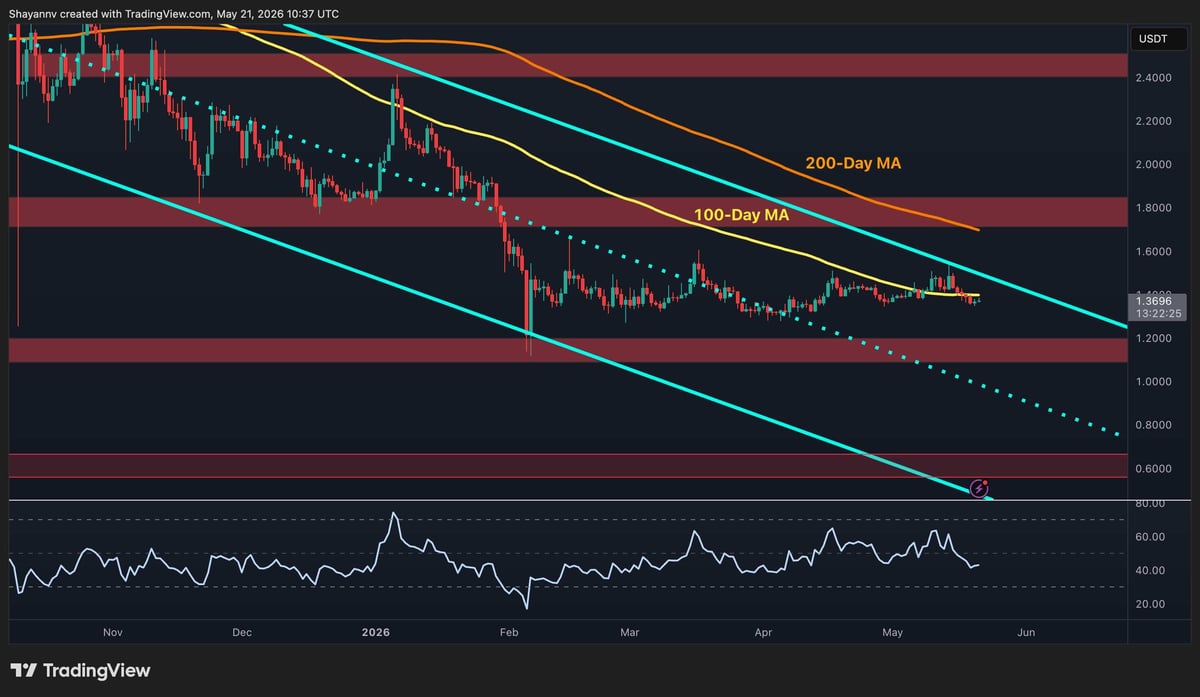
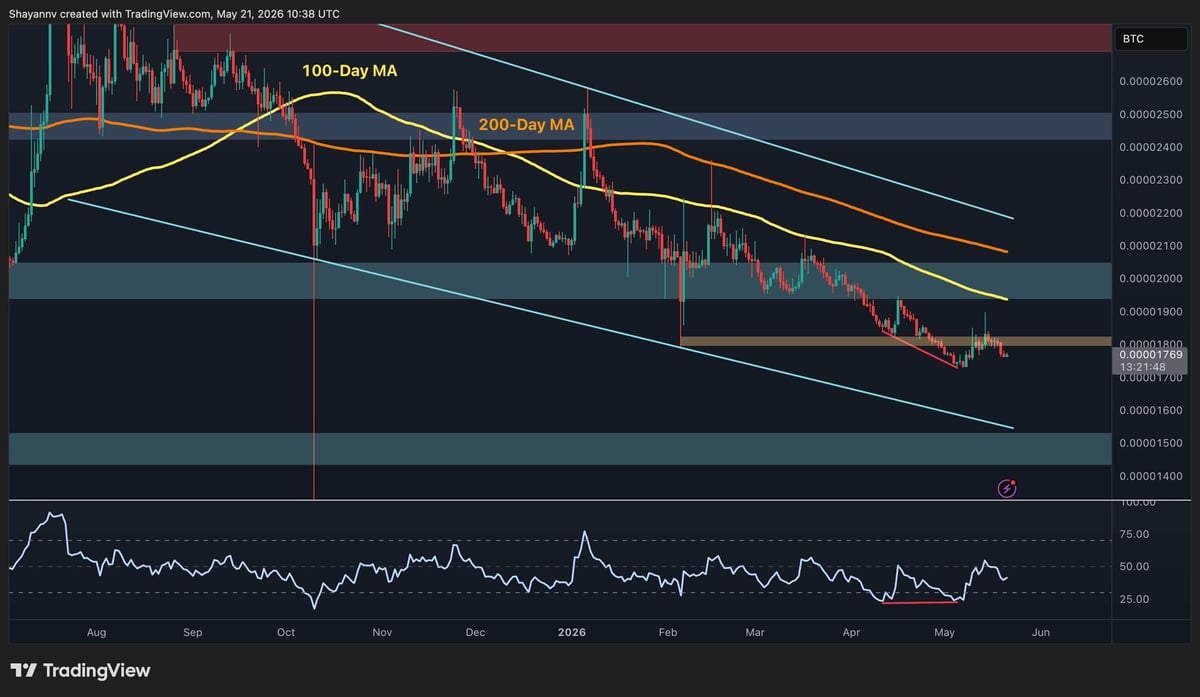
$XRP is trading at $1.37 as May draws toward its final week, having erased every gain from what briefly looked like the most promising technical setup of the corrective cycle. The breakout above the 100-day MA on the $USDT chart has failed to hold, and a lower high has formed on the $BTC pair. The levels that looked like support last week are now the targets that bulls need to reclaim just to get back to where they started.
Ripple Price Analysis: The $USDT Pair
The $USDT pair’s daily timeframe setup looked compelling last week. The asset was pressing the upper boundary of the long-term descending channel and holding above the 100-day moving average at around $1.45, with an RSI climbing toward 65.
Yet, this move has played out as a textbook rejection. $XRP failed to post a single candle close above the channel, and the subsequent sell-off has brought the price back to $1.37. The 100-day MA, which was seen as dynamic support just days ago, is now the nearby overhead resistance at $1.40, sitting just below the descending channel ceiling.