
In early action, the market flipped from a drift to a small bid as Avalanche price tests 9.45–9.50, yet the daily trend remains weak.
This moment matters because the short EMAs on the daily (20/50) have compressed into a single pivot. A clean reclaim turns the tape from repair mode to recovery mode. However, a failure here sends price back to grinding in the lower half of the recent range. For now, structure dominates momentum. Bulls are taking back levels, but they do not have trend control yet. This is a mean-reversion attempt inside a broader, damaged trend.
Multi‑timeframe view
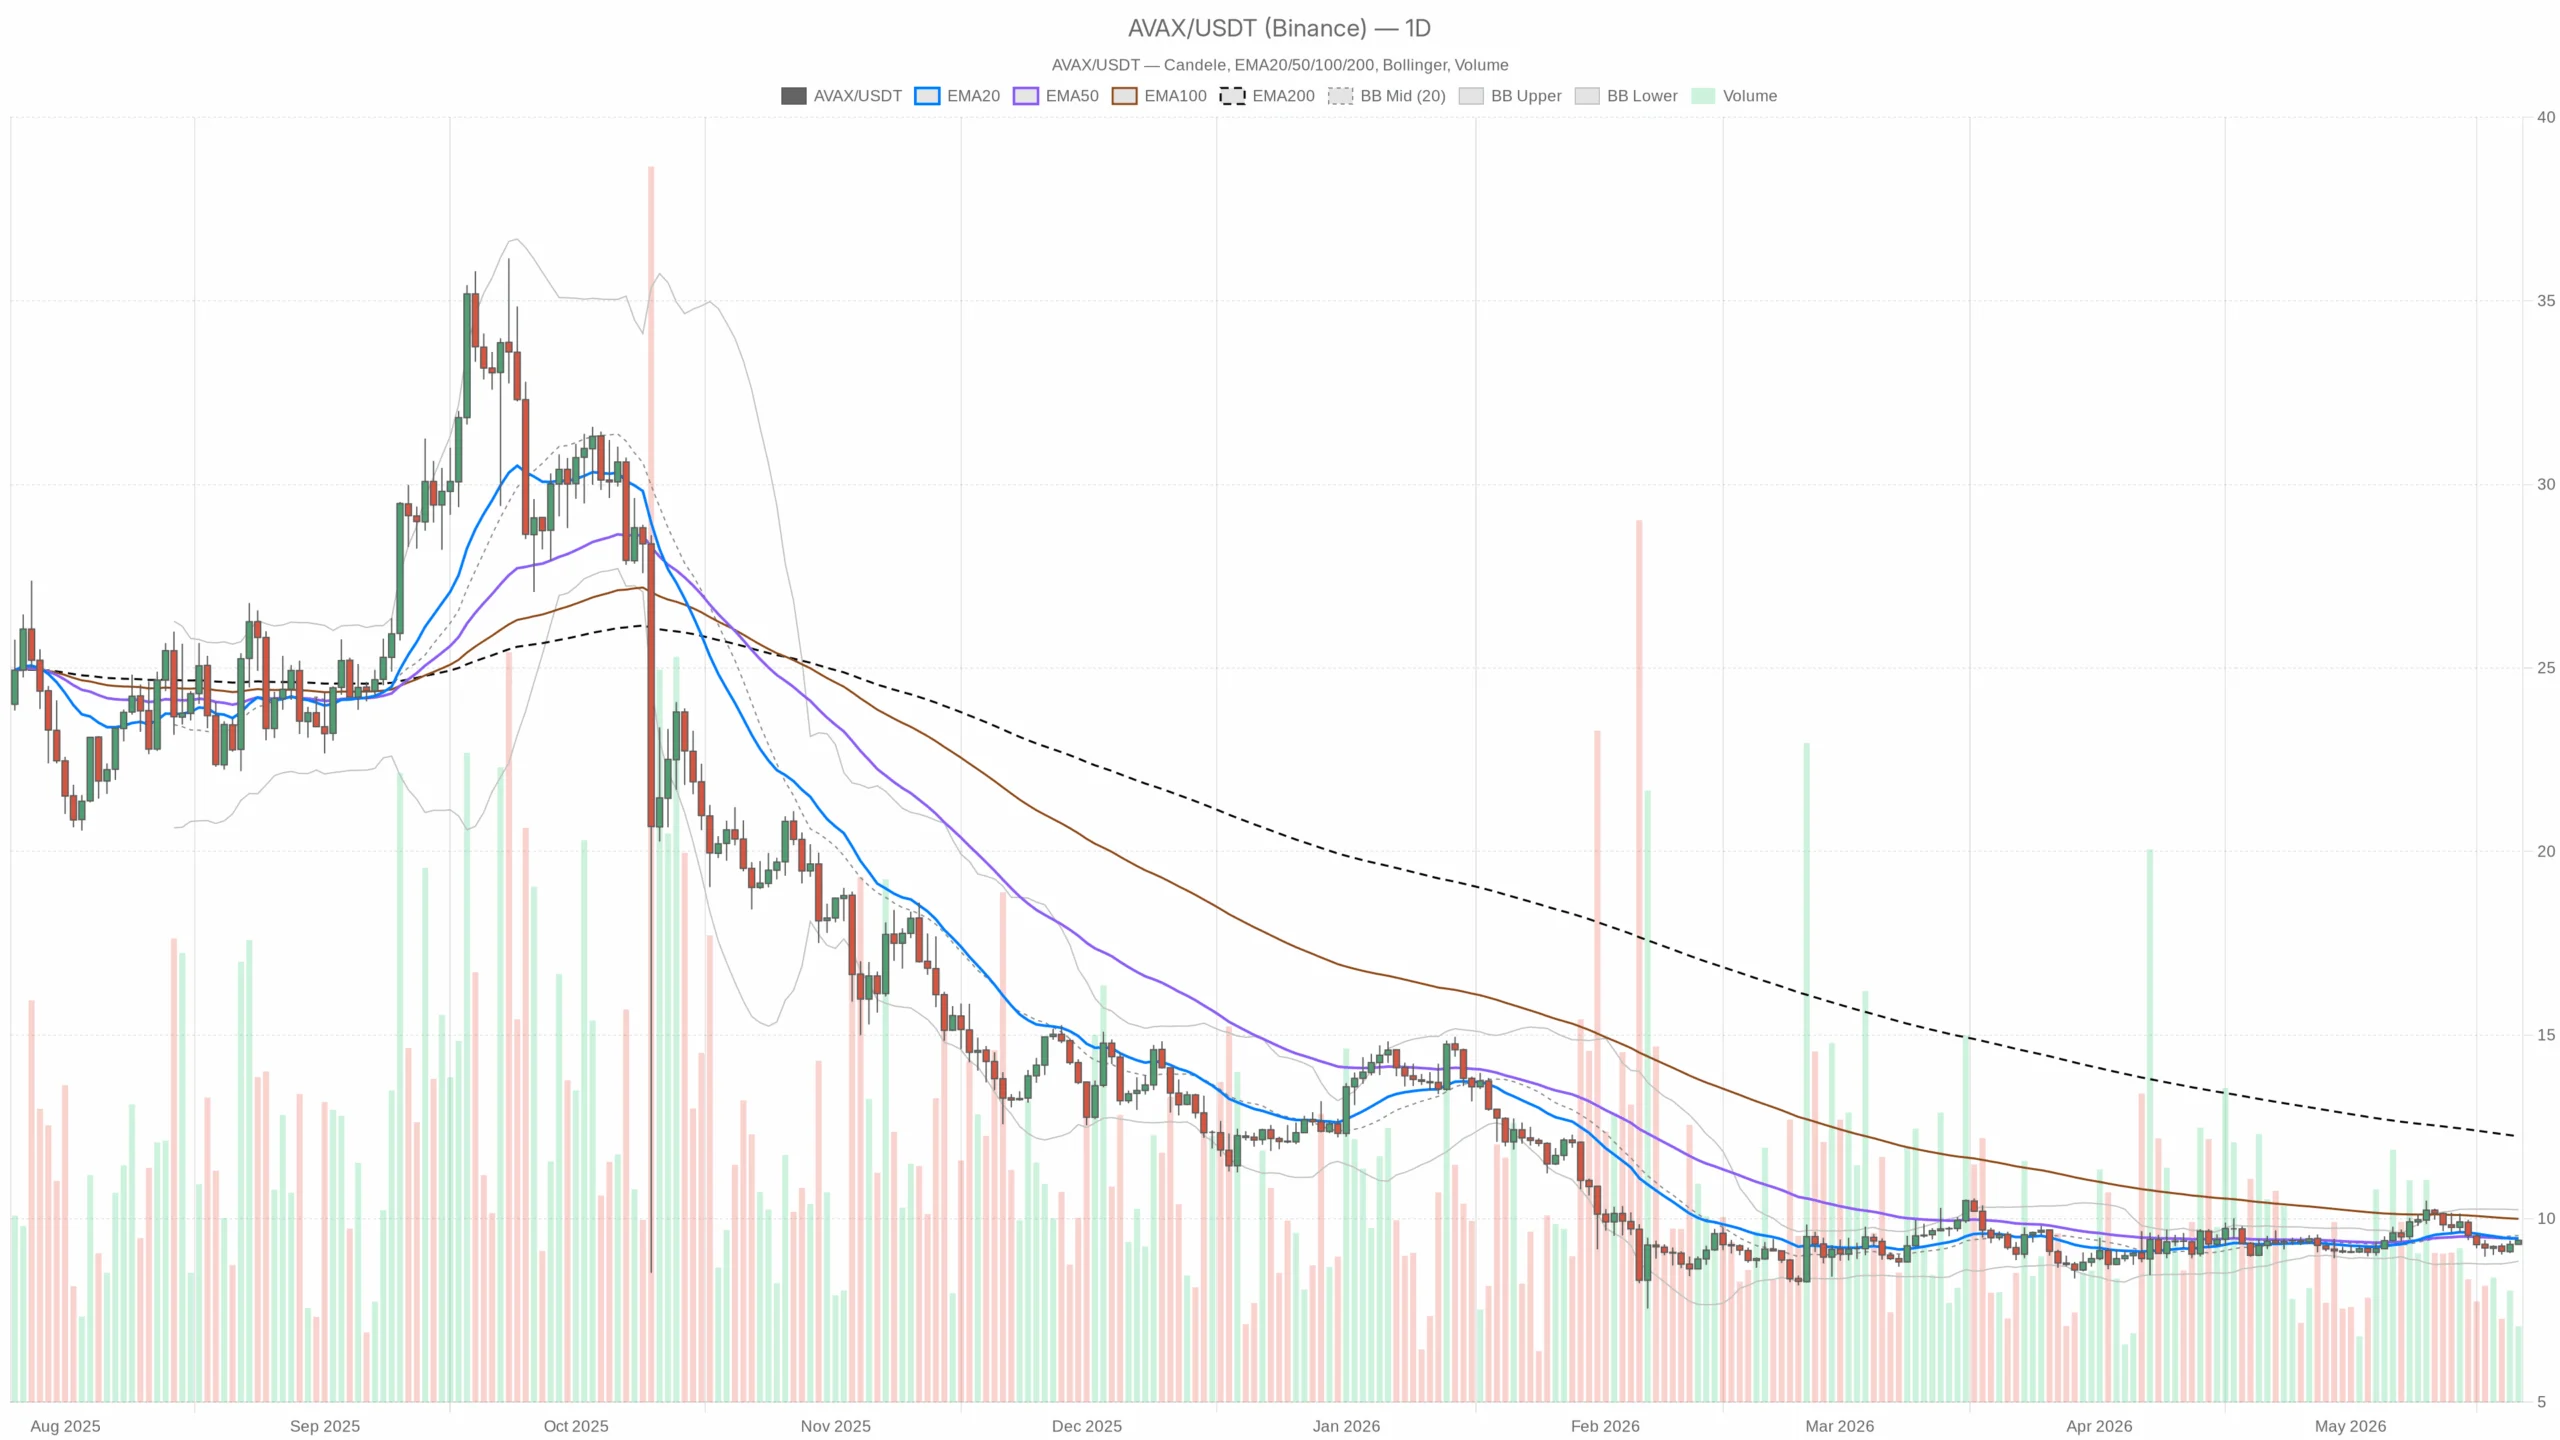
Daily (bias driver): Neutral with a slight bearish hangover. Avalanche price sits at 9.41, just under the 20/50-day near 9.46 and far below the 200-day at 12.24. A close above 9.50 would meaningfully improve the backdrop. Under 9.37 keeps it choppy to heavy.
1H (confirmation): Constructive but capped. Price is above the 1H 20/50 EMAs at 9.32 and 9.27 but just below the 1H 200 EMA at 9.42. Momentum is supportive. However, the longer intraday trendline remains the gatekeeper into 9.45–9.50.
15m (execution): Short-term momentum is stretched into local resistance. Price is riding the upper band with RSI in the mid-60s. Pullbacks to 9.38–9.40 are typical if 9.42–9.45 rejects on first touch.
Key indicators and levels (with context)
- EMA (Daily): 20D = 9.46, 50D = 9.46, 200D = 12.24; price = 9.41. Interpretation: The 20/50D overlap at 9.46 is a single switch. Reclaim it and the short-term bias turns up; stay below and the daily structure remains fragile beneath a declining 200D.
- RSI 14 (Daily): 48.9. Interpretation: No momentum edge—slightly below neutral. A push through 50 alongside a reclaim of 9.46 would mark a genuine momentum turn.
- MACD (Daily): Line -0.02 vs Signal 0.04, Hist -0.06. Interpretation: Bearish carryover is fading but not gone. It wouldn’t take much upside to flip this positive, which makes 9.46–9.50 a high-leverage area.
- Bollinger Bands (Daily): Mid 9.54, Upper 10.24, Lower 8.84. Interpretation: Trading below the midline keeps $AVAX in the lower half of the band—buyers are probing, not in control. There is room to travel either way. The next expansion move matters.
- ATR 14 (Daily): 0.42. Interpretation: Typical daily swing is about 4–5% of price. Position sizing and stops should respect that range. A 0.20 move intraday is ordinary noise.
- Pivots (Daily): PP 9.37, R1 9.45, S1 9.33. Interpretation: Price sits between PP and R1—neutral but pressuring resistance. Clear R1 and the door opens toward 9.60–9.80. Lose PP and S1 comes into view quickly.
- 1H Momentum Aids: RSI 64.6, MACD marginally positive; EMAs 20/50 above, 200 just above price at 9.42. Interpretation: Intraday tailwind exists, but it needs a firm push through 9.42 to avoid stalling into the 9.45–9.50 shelf.
- 15m Context: Price at the upper band (Mid 9.38, Upper 9.41) with RSI 65.5. Interpretation: Short-term stretch—first attempts into 9.42–9.45 can fade before any sustained break.
Market backdrop
BTC dominance sits elevated at ~58%, and the Crypto Fear & Greed Index is in Fear at 29. Consequently, that keeps altcoin risk appetite muted. Bounces on $AVAX can fade faster unless Bitcoin loosens its grip. Liquidity pockets are thinner, so moves into obvious levels may overshoot before reversing.
Scenarios
Bullish path: Intraday closes above 9.42 (1H 200 EMA) followed by a daily reclaim of 9.46–9.50 turn the bias constructive. From there, room opens toward 9.80 and then the daily upper band near 10.24. This works best if daily RSI pushes above 50 and MACD crosses up. Invalidation: A slip back below 9.37 that sticks, or a daily close under S1 at 9.33, would put the bounce back into question.
Bearish path: Failures at 9.45–9.50 lead to a roll back through 9.40 and 9.37, exposing 9.33. Below S1, the round 9.00 handle and the lower band at 8.84 come into play. Invalidation: A sustained daily close above 9.55 with RSI above 50 and a MACD bullish cross would neutralize the downside setup.
Positioning, risk, and uncertainty
This is a levels market; let price prove it. Reactive traders often prefer the reclaim, holding above 9.46 after a break, rather than anticipate it. Moreover, they fade clean rejections at 9.45–9.50 with tight risk. ATR argues for giving trades 0.25–0.45 room, depending on timeframe. With fear elevated and dominance high, expect head-fakes around 9.40–9.50. Be disciplined with exits, as momentum can switch quickly if Bitcoin twitches.
Overall, the tape is trying to repair while the higher trend remains damaged. A decisive reclaim of 9.46–9.50 would shift the backdrop toward recovery; a failure risks another grind within the lower range.