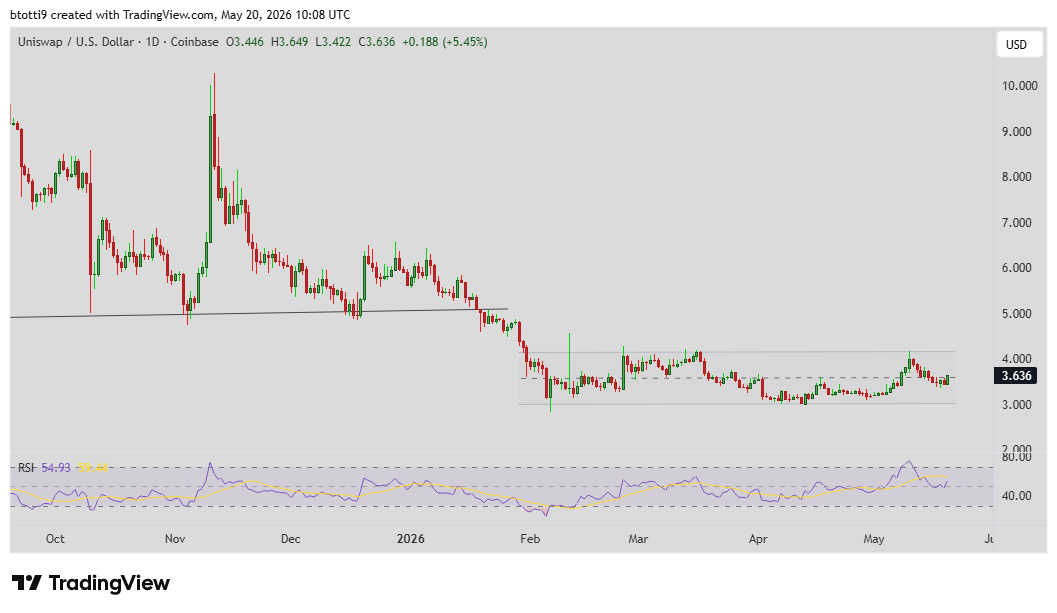
The $UNI token traded at around $3.60 at the time of writing, with prices up roughly 4% over the past 24 hours.
This saw Uniswap rank among the day’s stronger performers, but technical indicators and on-chain metrics suggest the token may still encounter headwinds before reclaiming a clear bullish trajectory.
Uniswap notches gains
$UNI’s intraday advance follows its recovery from this week’s lows around $3.35.
The bounce appears to have been aided by a decline in selling pressure, as indicated by CoinMarketCap data, which shows intraday trading volume down by approximately 22%.
The token is eyeing gains amid new whale activity, with two wallets recently accumulating more than 656,330 $UNI for roughly $2.33 million.
The buying suggests bulls may be positioning ahead of a potential breakout.
In terms of technical setup, this uptick comes amid subsiding liquidations and thinner order books.
Open interest in derivatives markets has also cooled, dipping by roughly 0.43%, a development that traders often interpret as reduced speculative leverage, which can temper extreme price moves in either direction.
Uniswap price forecast: sell signal persists
$UNI’s recovery is nonetheless gradual rather than explosive, and a retest of recent highs around the $3.65-$3.75 could fizzle.
In fact, the current price levels are close to a supply zone that has previously capped upside momentum.
The daily chart, for instance, shows that while the overall technical picture points to a buy opportunity, the price hovers below key moving averages on the daily chart.
As the chart below shows, the 100-day and 200-day exponential moving averages converge near the current trading band.
Currently, they form a supply wall that has historically limited upward moves.
However, the relative strength index (RSI) sits in neutral territory, suggesting there is room for further upside.
The Ichimoku Base Line also rests in a neutral zone, reinforcing the absence of a decisive trend.
A mixed technical outlook, therefore, paints both a lingering sell signal from longer-term positioning and moving-average alignment, and potential upward extension.
In practical terms, the token could test the resistance zone before retreating.
$UNI has been in a horizontal channel since sliding below $4.20 in late January, and sideways trading could continue if buyers fail to inject fresh volume.
Sellers reasserting control could push prices back toward recent lows.
The key technical levels to watch in the immediate term are $3.75-$4.10, which represent recent highs and the prior supply zone.
$UNI touched a high of $6.20 in December 2025. If selling mounts, support could be in the $2.90-$3.00 range, levels that align with a previous consolidation area.