
Cryptocurrencies continue to navigate a period of heightened volatility, with major digital assets including Bitcoin ($BTC), Ethereum ($ETH) and Ripple ($XRP) holding firmly above key support areas at the time of writing on Tuesday.
Bitcoin hovers just above $77,000, struggling to gain momentum amid escalating geopolitical tensions stemming from the US-Iran conflict. This situation is compounded by rising inflation driven by surging oil and gas prices, which is creating increased anxiety throughout global markets.
In contrast, Ethereum has demonstrated stability, maintaining support above $2,100, while $XRP continues its downward trend, eyeing the $1.35 support level.
ETF outflows weigh on fragile recovery
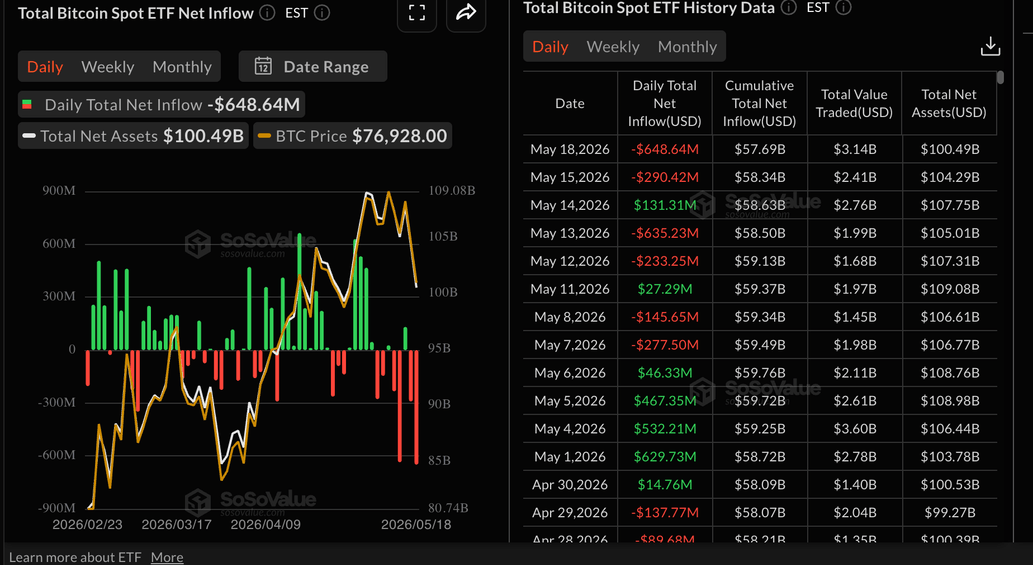
Bitcoin spot Exchange-Traded Funds (ETFs) logged staggering outflows reaching $649 million on Monday, further denting the fragile recovery to $82,850 in early May. If outflows persist, Bitcoin could remain vulnerable to intense headwinds, with losses likely to extend toward the $70,000 demand area.
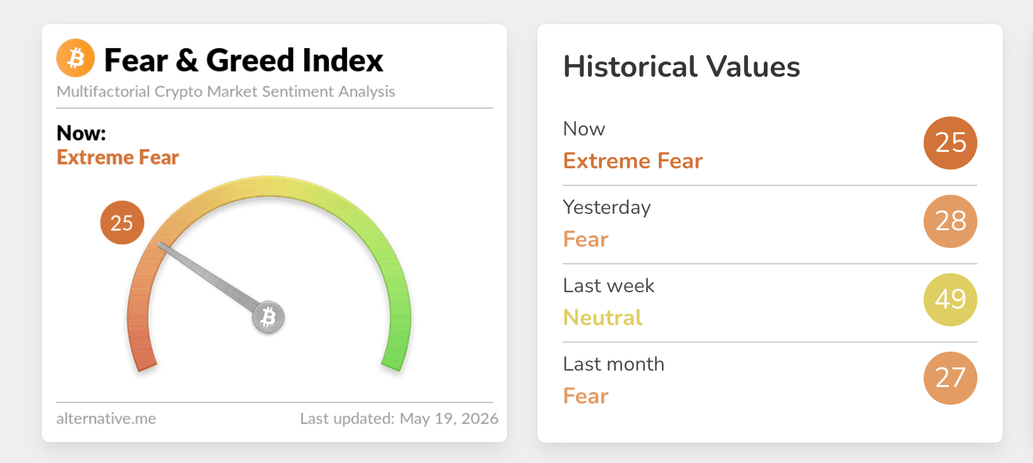
The crypto Fear & Greed Index shows a significant drop in broader market sentiment to 25 in the Extreme Fear territory on Tuesday, from 28 the previous day and 49 last week, and aligns with the persistent risk-off mood.
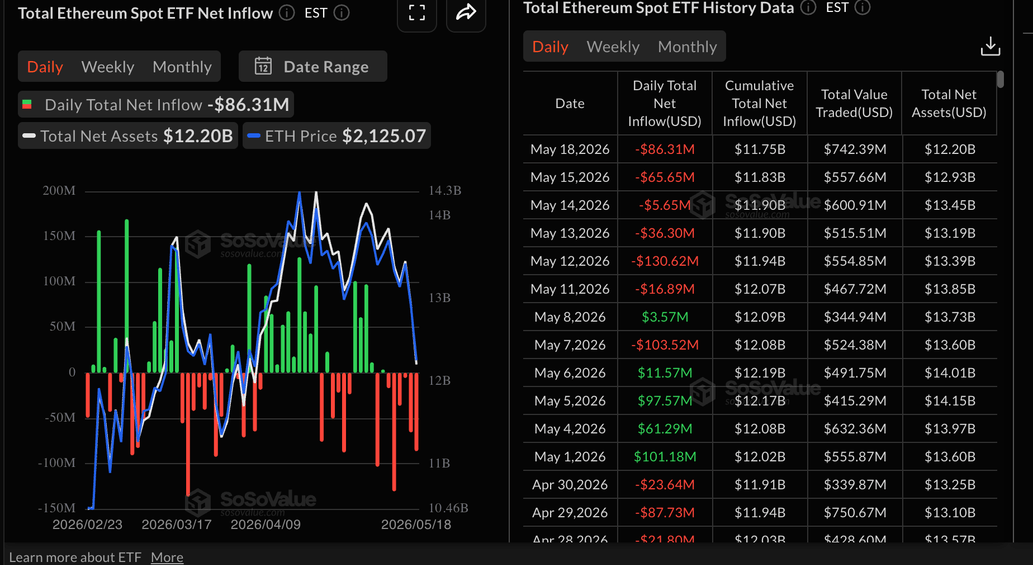
Ethereum spot ETFs reflected the headwinds in the crypto market, as outflows hit a sixth consecutive day on Monday, with institutions withdrawing $86 million. Despite the outflows, cumulative inflows remain positive at $11.75 billion while net assets under management average $12.20 billion.
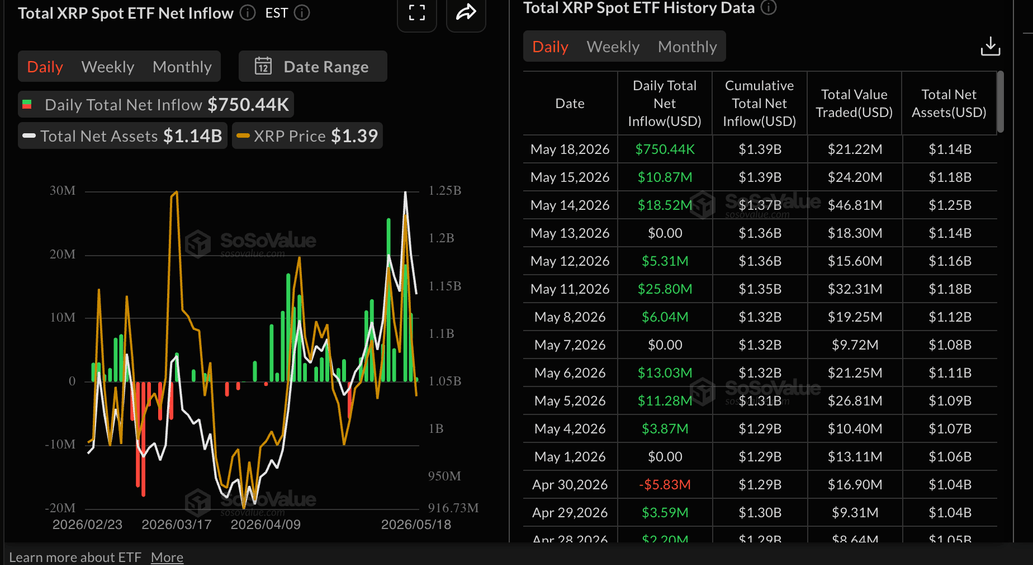
$XRP spot ETFs, on the other hand, saw mild inflows totaling $750,000 on Monday, marking a significant drawdown from nearly $11 million recorded on Friday. Cumulative inflows remain steady at $1.39 billion, while net assets shrink slightly to $1.14 billion.
Price analysis: Bitcoin consolidates losses as support holds
Bitcoin trades above $77,000 at the time of writing on Tuesday. The pair is consolidating just above the 50-day and 100-day Exponential Moving Averages (EMAs) at $76,751 and $76,877, respectively, but remains capped well below the 200-day EMA near $81,828, leaving the broader tone neutral to slightly bearish.
The Relative Strength Index (RSI) hovers around 46 on the daily chart, while the Money Flow Index (MFI) slips toward the low-30s, suggesting waning buying pressure. At the same time, the Moving Average Convergence Divergence (MACD) histogram remains negative on the same chart, hinting at a fragile recovery under a still-dominant higher-timeframe cap.
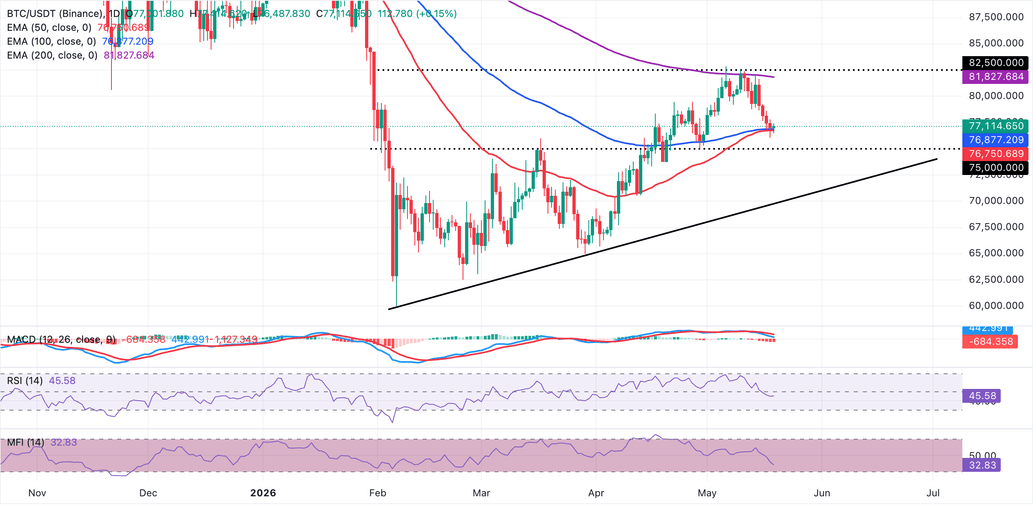
On the topside, the 200-day EMA around $81,828 is the key resistance that bulls need to reclaim to revive a more constructive medium-term trend. On the downside, immediate support is seen around the current price band clustered with the 100-day EMA at $76,877 and the 50-day EMA at $76,751, while a deeper pullback would expose the prior trendline break area near $69,800 as the next major demand zone.
Altcoins technical outlook: Ethereum and $XRP struggle for momentum
Ethereum trades at $2,133, maintaining a bearish near-term tone as price holds below the 50-day, 100-day, and 200-day EMAs, which are clustered between roughly $2,250 and $2,530. The MACD histogram sits in negative territory, with its latest reading on the daily chart below zero, while the RSI hovers near 36 and the MFI around 35, all of which suggest persistent downside pressure.
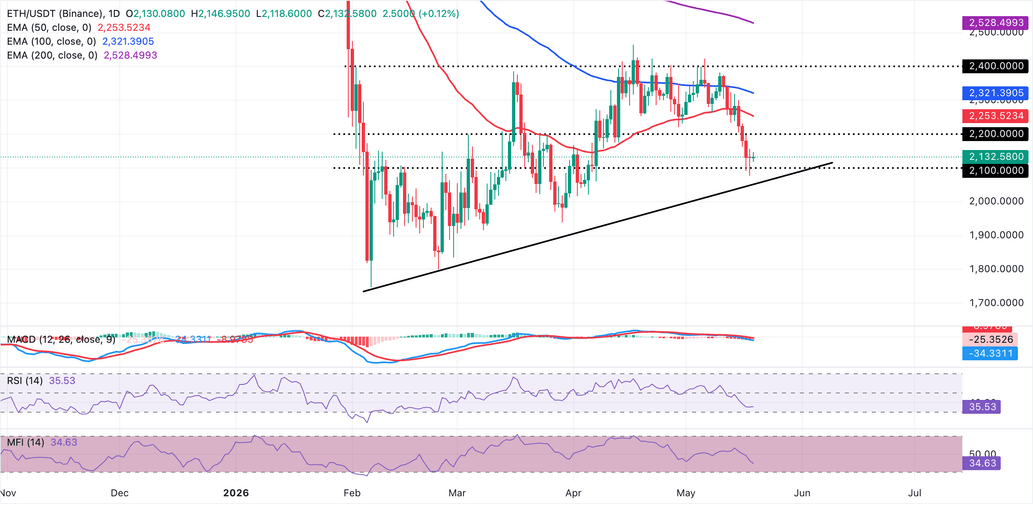
On the downside, initial support is seen near the ascending trendline around $2,052, where buyers may attempt to stabilize the decline. On the topside, immediate resistance comes in at the 50-day EMA near $2,254, followed by the 100-day EMA around $2,321 and the more strategic 200-day EMA near $2,528. Unless $ETH can reclaim these successive barriers, rallies are likely to be viewed as corrective within a broader capped structure.
$XRP, on the other hand, trades at $1.38, maintaining a bearish near-term bias as it sits below the main EMAs. The 50-day EMA at $1.41, along with the 100-period EMA at $1.49 and the 200-day EMA at $1.70, all overhead, suggests rallies are likely to face headwinds.
Momentum indicators reinforce this cautious tone, with the RSI hovering around 44 on the daily chart and the MACD histogram in negative territory, hinting at lingering downside pressure.
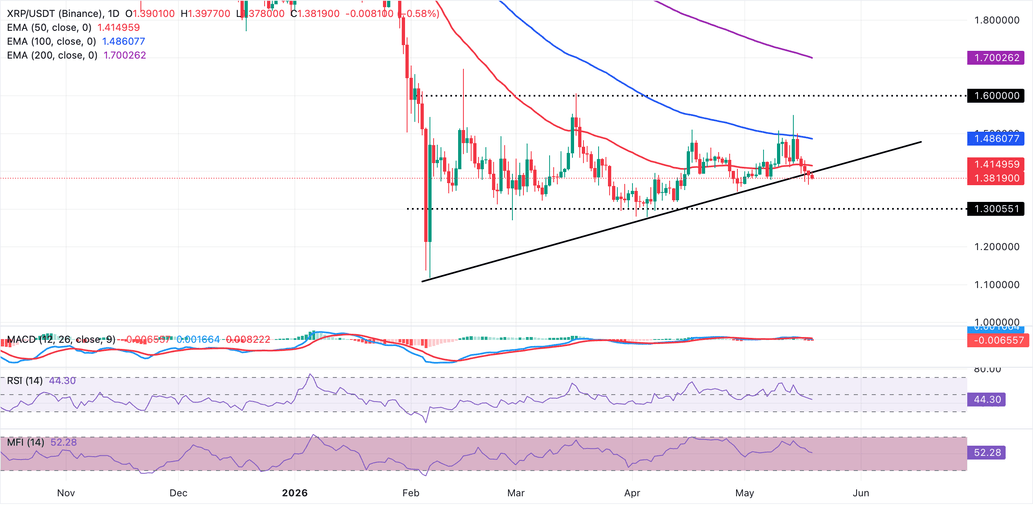
On the topside, initial resistance lies at the rising trendline near $1.40, with the 50-day EMA at $1.42 as the next cap if buyers attempt a rebound. A sustained break above that zone would then expose the 100-day EMA at $1.49, while any more ambitious recovery would likely stall ahead of the 200-day EMA around $1.70. If the sell-off continues, $XRP could drop to retest a short-term support at $1.35, with extended pressure likely to expose a deeper demand level at $1.30.
(The technical analysis of this story was written with the help of an AI tool.)