Something quiet is happening on Stellar. The developers are showing up — and they are showing up faster than on any other major chain.
According to Electric Capital, Stellar recorded 86% year-over-year growth in total developers in Q1 2026 — making it the fastest-growing developer ecosystem of any major blockchain.
The network now has 4,400+ developers engaged worldwide. Over three years, the developer community has grown 171%. Developer growth is a leading indicator.
It is the layer that turns assets into products. Price tends to follow — but not always immediately.
Does a 171% Developer Surge Actually Mean Anything for $XLM?
Stellar crossed $2 billion in tokenized real-world assets and $5.5 billion in payment volume in Q1 2026 — a 72% year-over-year increase.
Spiko accounts for $776.8 million in tokenized assets on the network. Franklin Templeton holds $657.9 million. Bitbond adds $463.1 million.
MoneyGram now operates in 180 countries on Stellar. U.S. Bank recently piloted its own stablecoin on the network.
The Bermuda government selected Stellar for its national digital economy payments on May 13.
$XLM is also one of only seven assets in CME’s new Nasdaq Crypto Index futures — alongside Bitcoin and Ethereum. That is infrastructure, not speculation.
While Builders Build, the Chart Tells a Different Story
XLMUSD (Weekly): As of May 17, 2026 timestamped 06:57 UTC, $XLM trades at $0.151521, down -0.14% on the week. The Parabolic SAR at $0.184669 sits above price — the weekly trend is technically bearish.
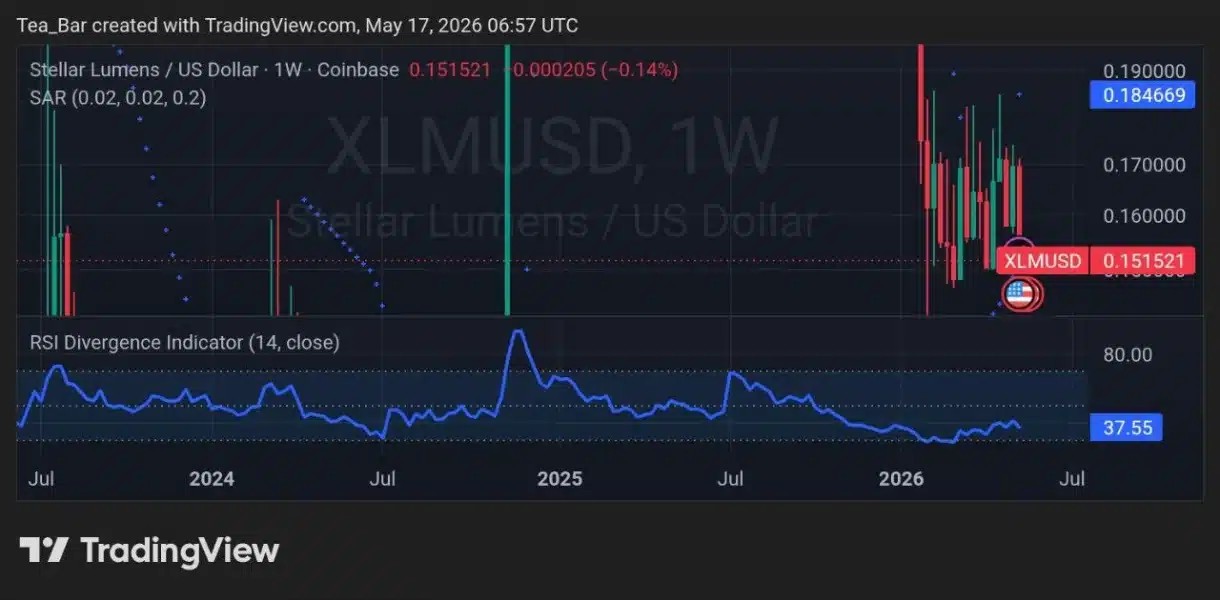
The RSI Divergence Indicator at 37.55 is approaching the historically significant 30 level — a zone that has consistently marked $XLM’s most decisive recoveries on this timeframe.
Looking at the full chart, every time the RSI has touched this level and turned upward, a meaningful price expansion followed.
The red dashed horizontal near $0.150 is the structural floor being tested right now. It has held across multiple prior corrections going back years.
A weekly close below it would shift the technical picture significantly.
A hold here — with the RSI curling upward from near 30 — is the exact setup that preceded prior $XLM rallies.
The SAR above price keeps the bias technically bearish. But the RSI at this level has historically been a more reliable early signal than the SAR on $XLM’s weekly chart.
XLMBTC (Weekly): Against Bitcoin during the same time and day, $XLM sits at 0.00000194 — far from its cycle high of 0.00000649.
The Bollinger Bands show price pressing below the lower band at 0.00000197. The mid-SMA is at 0.00000228, the upper at 0.00000259.
Price below the lower Bollinger Band is a rare condition on this pair. It has historically been followed by a reversion toward the mid-band at minimum.
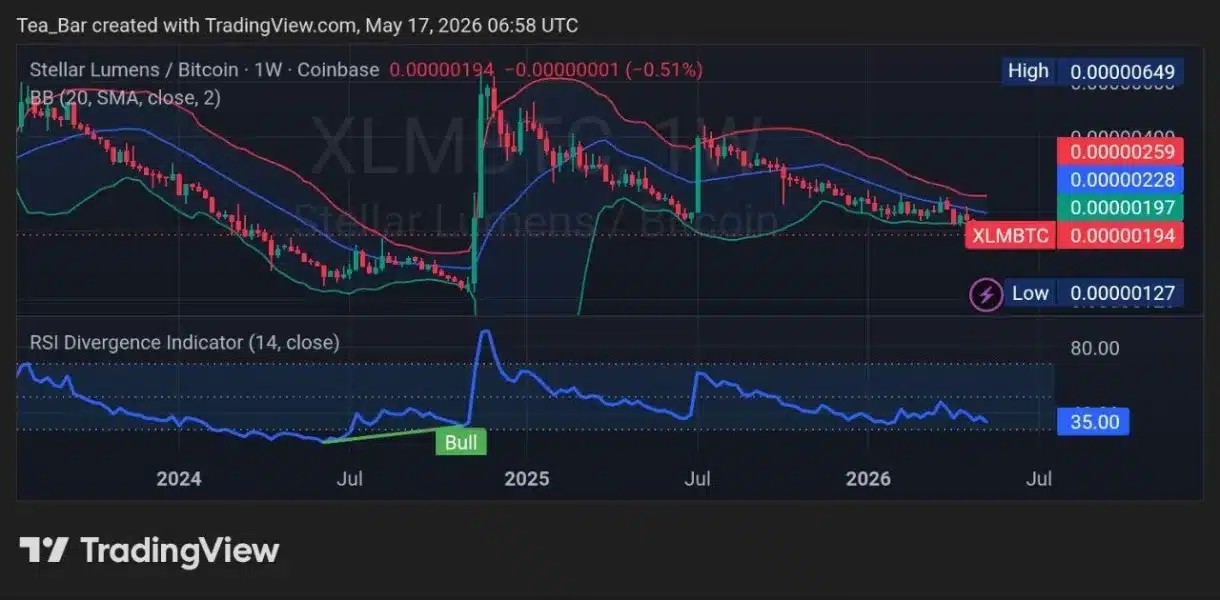
The RSI Divergence Indicator at 35.00 is approaching the 30 level. A “Bull” divergence signal appeared on this chart in mid-2024 — which preceded the entire 2024–2025 rally.
The bands are also compressing — a directional move is building. The direction has not been confirmed yet.
Will the Market Eventually Price In What the Network Has Already Become?
Institutional tokenization growth on Stellar has not yet spurred $XLM demand — suggesting a disconnect between network utility and token value.
A reclaim of $0.1819 is the first technical gate. Failure there may signal deeper decline despite the positive fundamentals. The developers are building.
The institutions are tokenizing. The infrastructure is expanding. If utility-driven demand eventually translates into on-chain $XLM settlement volume — does the price stay at these levels, or does the market finally start pricing in what the network has already become?
Disclaimer:
This article is for informational purposes only and does not constitute financial, investment, or trading advice. The views expressed are based on publicly available data, market observations, and the author’s interpretation at the time of writing. Cryptocurrency markets are highly volatile and unpredictable, and past performance or current technical setups do not guarantee future results. Readers should conduct their own research and consult with a qualified financial advisor before making any investment decisions. TechGaged does not accept liability for any losses incurred based on the information presented.