
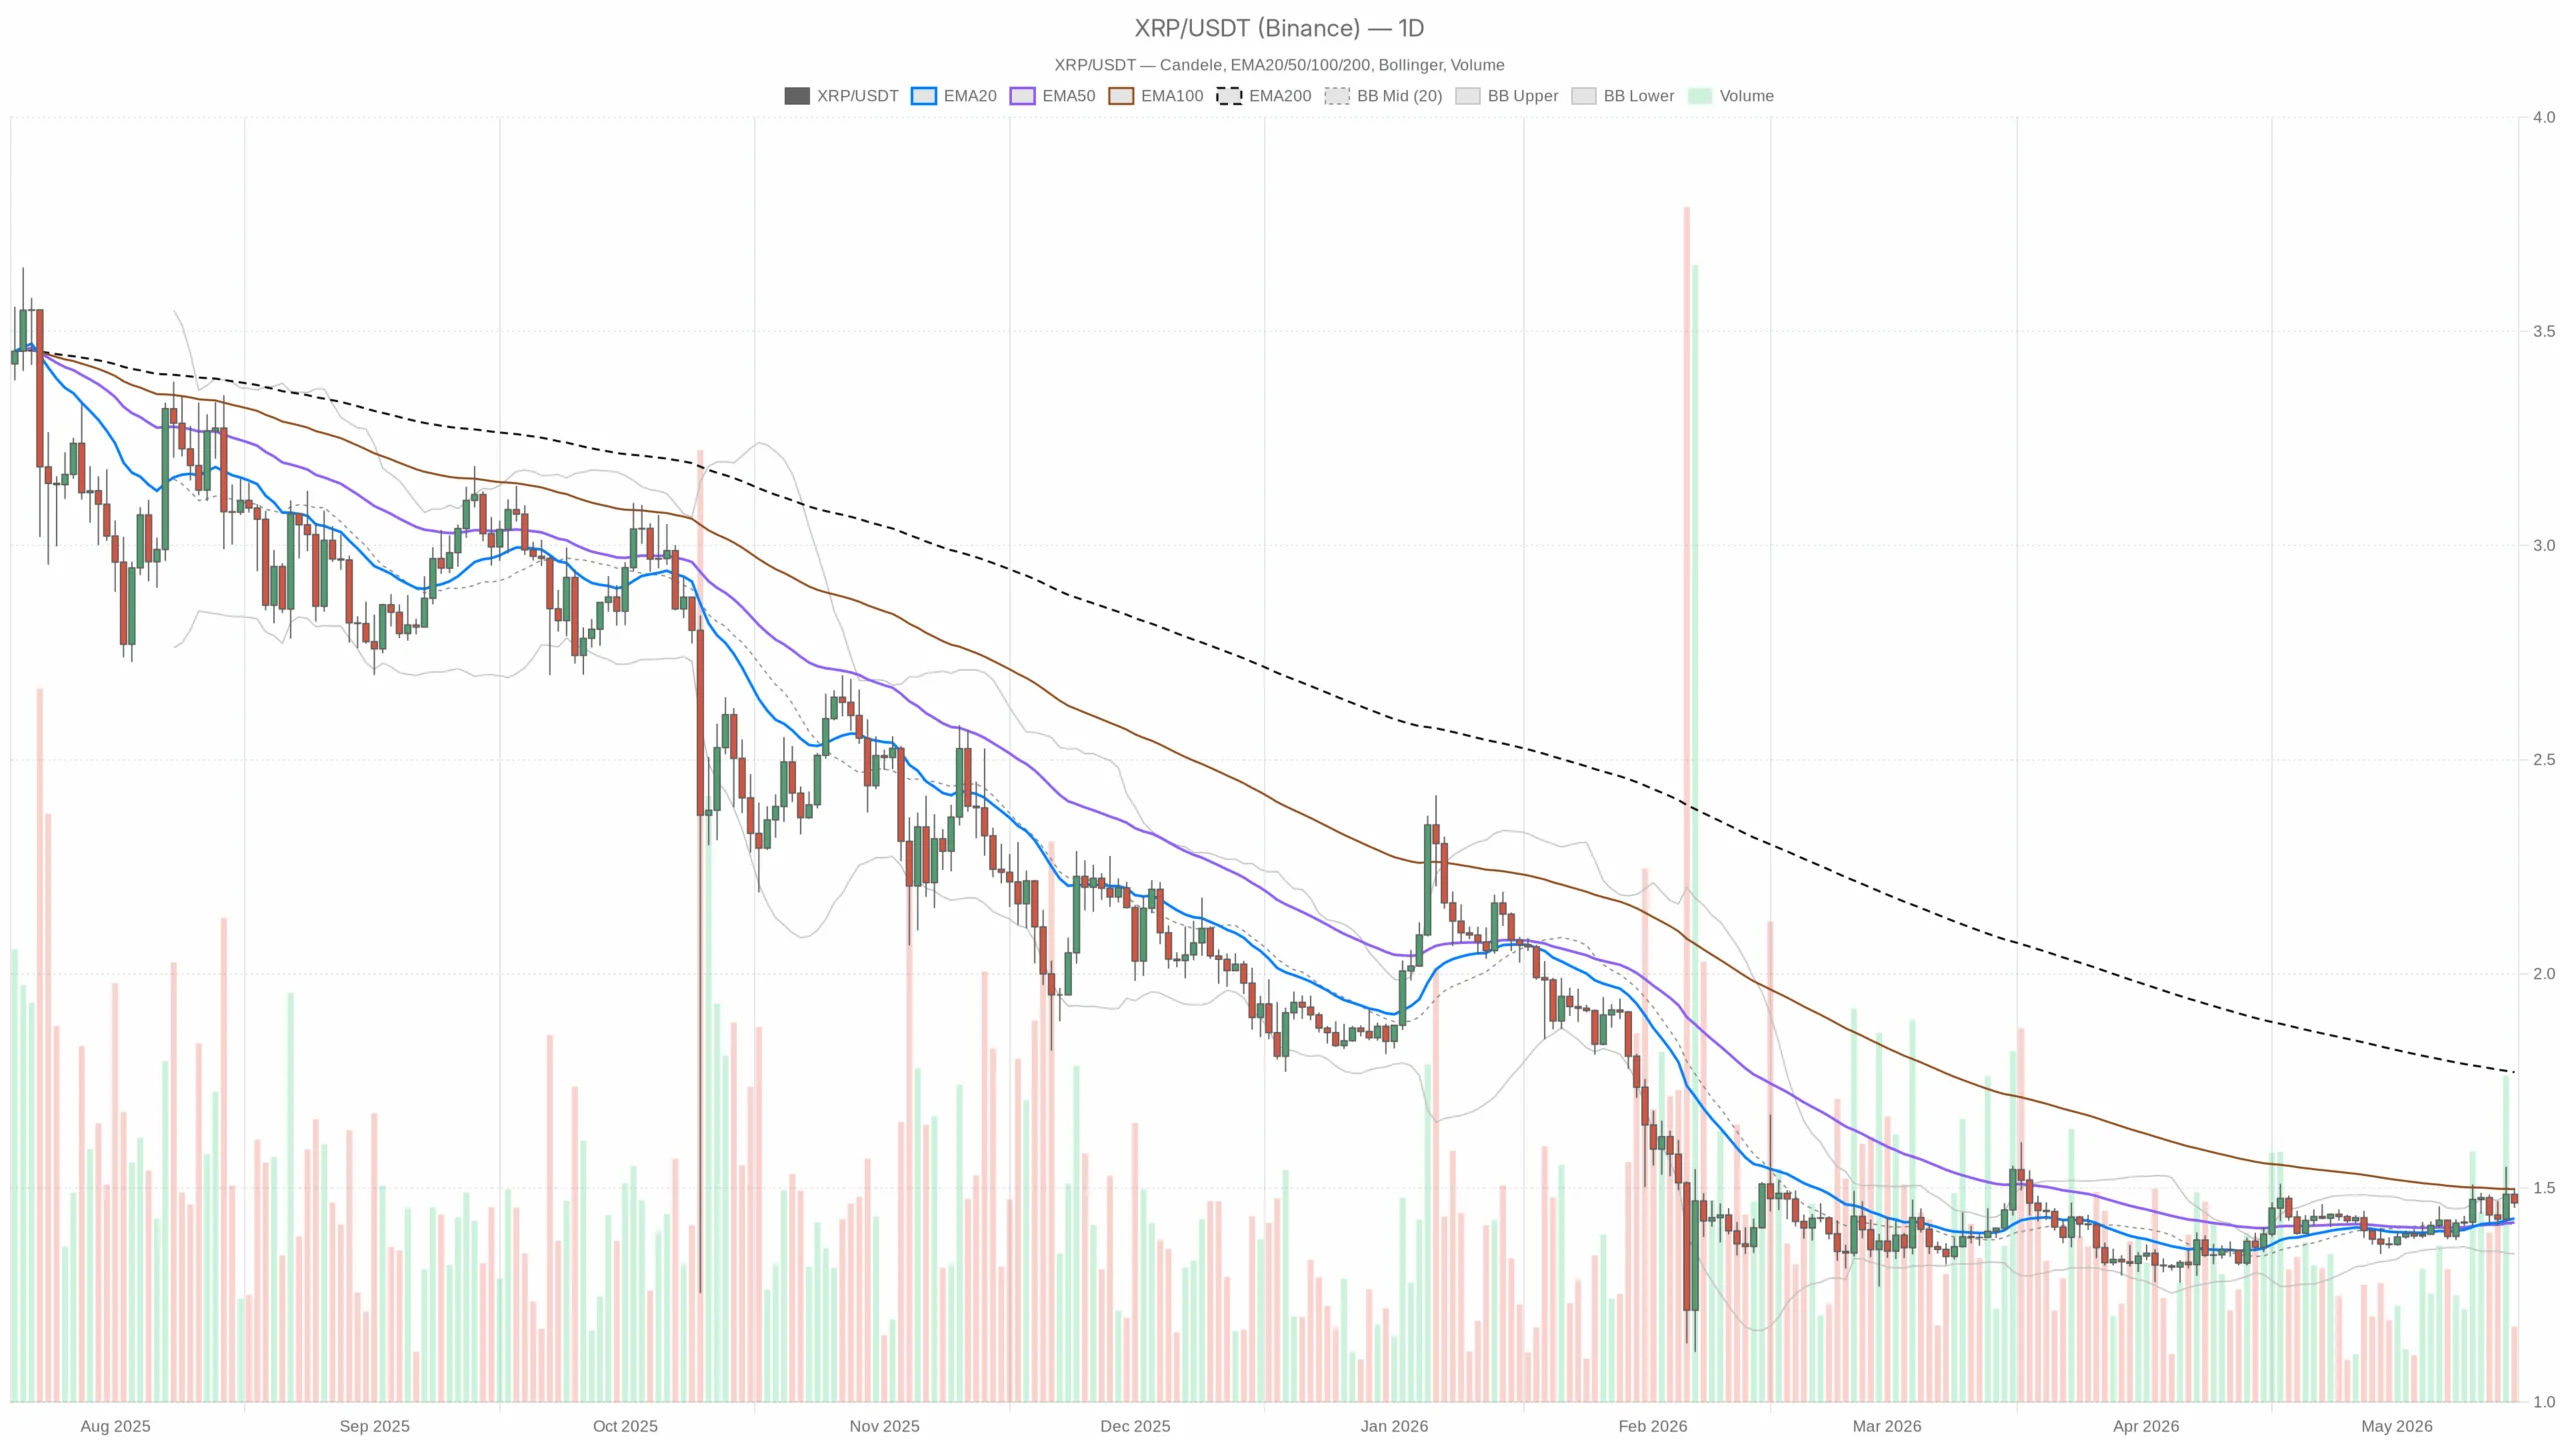
Momentum is edging higher, yet structure has not fully flipped. With Ripple price today at $1.47 near the upper Bollinger band and pinned to the daily pivot, $XRP still sits below its 200-day EMA at $1.77.
Main scenario (based on Daily): Neutral, with a bullish tilt
Price is at $1.47, pinned to the daily pivot and a breath from the upper Bollinger band. The market is pushing higher on short timeframes. However, the bigger picture carries overhead weight: $XRP trades well below its 200-day EMA at $1.77. That mix makes today important; momentum is trying to extend, yet structure has not fully flipped.
Context matters. Meanwhile, crypto’s total market cap is up about 0.9% in the last day with Bitcoin dominance near 58%, while the Fear & Greed Index is at 43 (Fear). In plain English, risk appetite is improving but still cautious. For $XRP, Ripple price today reflects range behavior with a bullish lean, constrained by higher-timeframe resistance.
On the daily chart, $XRP is riding above its 20/50 EMAs and edging toward band resistance at $1.49–$1.50. However, the 200-day EMA at $1.77 keeps the macro trend unproven. Bulls have the initiative short term; the longer trend needs more work.
Multi-timeframe read
Daily (macro bias): Price at $1.47 is above the 20/50-day EMAs and near the upper band ($1.49). RSI is constructive and MACD is positive, so momentum backs a push into resistance. The snag is structural: the 200-day EMA sits far overhead at $1.77, so rallies can fade unless buyers keep pressing.
1H (confirmation/risk): Intraday momentum has cooled. Price is hovering around the 1H 20-EMA ($1.47) and just under the Bollinger mid-line ($1.48). RSI near 47 and a slightly negative MACD histogram show a pause rather than a breakdown. Reclaiming and holding above $1.48 would reassert the intraday up-bias; slipping to $1.46–$1.45 would invite a deeper test of the daily mean.
15m (execution context): Price dipped to $1.46 near the 15m lower band and the 200-EMA, with RSI around 36. That is classic short-term exhaustion where bounces often begin. However, until $1.47 is retaken, it is a soft tape and scalps remain two-sided.
Daily indicator check (evidence)
- RSI (14): 57.4 — Buyers control the tape without being stretched; room remains before overbought fatigue.
- MACD: Line 0.02 over Signal 0.01, Hist +0.01 — Positive but modest momentum; it supports an attempt at $1.49–$1.50, not a vertical breakout.
- EMAs: 20D $1.43, 50D $1.42, 200D $1.77 — Price above 20/50D signals short-term repair; the 200D far overhead keeps the macro trend unconfirmed.
- Bollinger Bands (20D): Mid $1.42, Upper $1.49, Lower $1.35 — Price leaning on the upper band signals pressure into resistance; a close above the band would mark a momentum expansion.
- ATR (14D): $0.05 — Daily swing of ~3–4%; a move from $1.47 to $1.53 would already be a >1×ATR day and likely needs a catalyst.
- Pivots (Daily): PP $1.47, R1 $1.49, S1 $1.45 — The market is parked at PP; the next decision is acceptance above $1.49 or rejection back toward $1.45.
Intraday evidence
1H
- RSI (14): 47.4 — Momentum flat; neither side has a grip.
- MACD: Hist -0.01 — Mild bearish fade; it argues for patience on longs until $1.48 is reclaimed.
- EMAs: 20H $1.47, 50H $1.46, 200H $1.44 — Price still above 50/200H, so the trend is intact but losing steam at the 20H.
- Bollinger (20H): Mid $1.48, Upper $1.53, Lower $1.44 — Under the mid-line; upside needs a quick recapture of $1.48 to target the $1.50 handle and, if extended, $1.53.
- ATR (14H): $0.02 — Typical hourly swing ~1–1.5%; enough to tag $1.49, but a push to $1.53 would be a strong session.
- Pivots (1H): PP ~$1.47 with S1 $1.46 — Congestion around $1.47; a slip to $1.46 is the first test for dip buyers.
15m
- RSI (14): 35.7 — Short-term washed out; bounce risk is rising.
- MACD: Flat near zero — Momentum is stabilizing; direction will follow the next reclaim or break.
- EMAs: 20/50 below price, 200 at ~$1.46 — Price testing the 200-EMA; it is the pivot for a micro-bounce vs. a trend slip.
- Bollinger: Mid $1.47, Lower $1.46 — Riding the lower band; a move back to $1.47 would be a routine mean reversion.
- ATR (14): $0.01 — Tight micro-range; breakouts can look noisy but travel quickly once released.
- Pivots (15m): PP $1.47, S1 $1.46 — Intra-scalp line in the sand at $1.46.
Trade paths
Bullish scenario: Hold $1.46–$1.45 (1H S1 / Daily S1) and reclaim $1.48 (1H band mid). A firm push through $1.49–$1.50 (Daily R1/upper band) opens an extension toward $1.53 (1H upper band). Follow-through requires daily closes above $1.50 to start building a base for higher highs. Invalidation: A daily close back below $1.43–$1.42 (20D EMA / band mid) or an H1 breakdown beneath $1.45 would turn the bias back to range-to-down.
Bearish scenario: Rejection in the $1.49–$1.50 supply zone with intraday failure back under $1.46 leads to a test of $1.45. Loss of $1.45 shifts focus to $1.43–$1.42 (daily mean area), with room for a stretch to the lower band near $1.35 if market risk-off returns. Invalidation: Acceptance above $1.50 with rising H1 momentum (RSI back above 55 and MACD flipping positive) neutralizes the short and favors continuation to $1.53.
Positioning, risk, and uncertainty
This is a neutral market with a bullish lean into resistance — not a blue-sky trend. Tactically, it makes sense to respect location: strength only really earns respect above $1.49–$1.50, while dips toward $1.46–$1.45 are where the daily mean reversion lives.
Additionally, with a daily ATR near $0.05, position sizing should assume 3–4% routine swings and leave room for noise. BTC’s high dominance and a ‘Fear’ tape mean altcoin rallies can stall quickly; be ready to adjust if $1.48 fails to hold on retests or if breakouts lack volume.
Bottom line: For the live Ripple price at $1.47, the next decisive move hinges on the $1.49–$1.50 lid and the $1.45 floor. Momentum favors a test higher; structure demands proof.