Dogecoin is holding its long-term trendline, but the daily chart still shows a weak recovery structure. $DOGE needs a stronger breakout above resistance to shift the setup away from another possible decline.
Dogecoin Holds Long Term Trendline as $DOGE Compression Builds
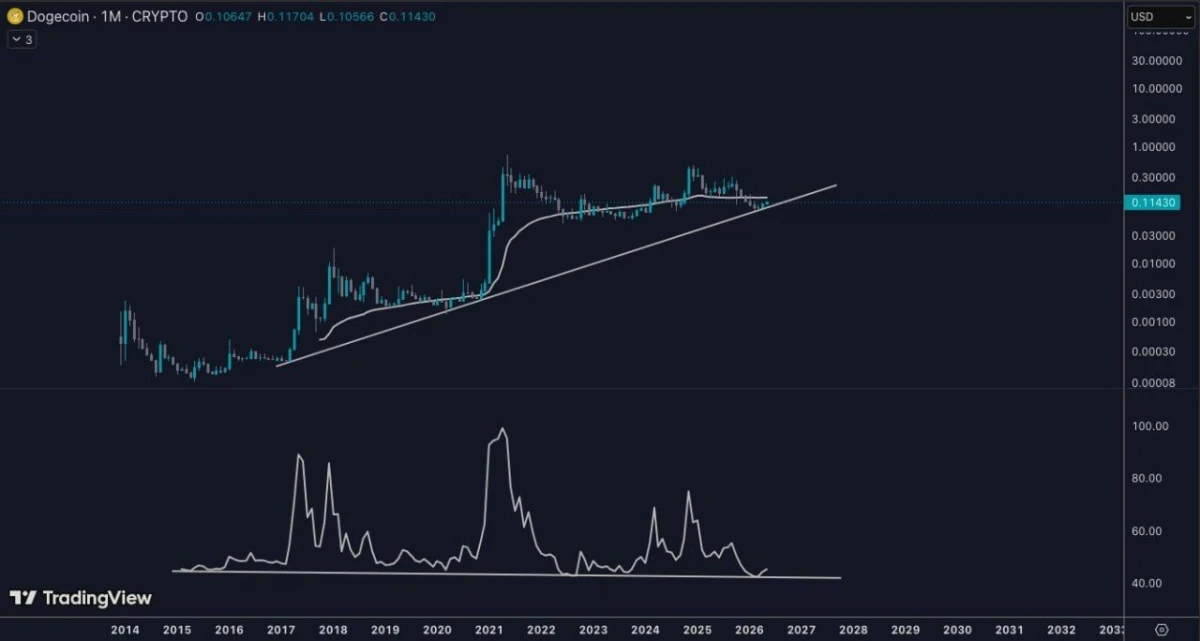
Dogecoin is holding near a long term rising trendline on the monthly chart shared by Surf.
The chart shows $DOGE moving above the same broad support line that has guided the price structure since the earlier cycle lows. Each major move higher started after price spent time near this long term base.
Dogecoin Monthly Long Term Trendline Chart. Source: Surf on X
$DOGE is now trading close to that trendline again, while price also moves near a curved moving average shown on the chart. This creates a compression zone, where price action tightens before the next larger move.
The lower indicator also shows a long period of reduced momentum after previous spikes in 2017, 2021, and 2024. The current reading sits near the lower range, which suggests $DOGE has cooled down after earlier volatility.
If $DOGE holds the rising trendline, the chart keeps the broader bullish structure active. A stronger move above the nearby moving average would support a possible recovery attempt.
However, if $DOGE breaks below the long term trendline, the setup would weaken. That would show that the current compression failed and that sellers regained control.
Dogecoin Recovery Stays Corrective as $DOGE Tests Key Resistance
Dogecoin is moving higher from its recent lows, but the recovery still looks corrective on the daily chart shared by MCO Global.
The chart shows $DOGE trying to push above the short term resistance area near $0.118. This level matters because price has already reacted near it after forming a rebound from the March low.
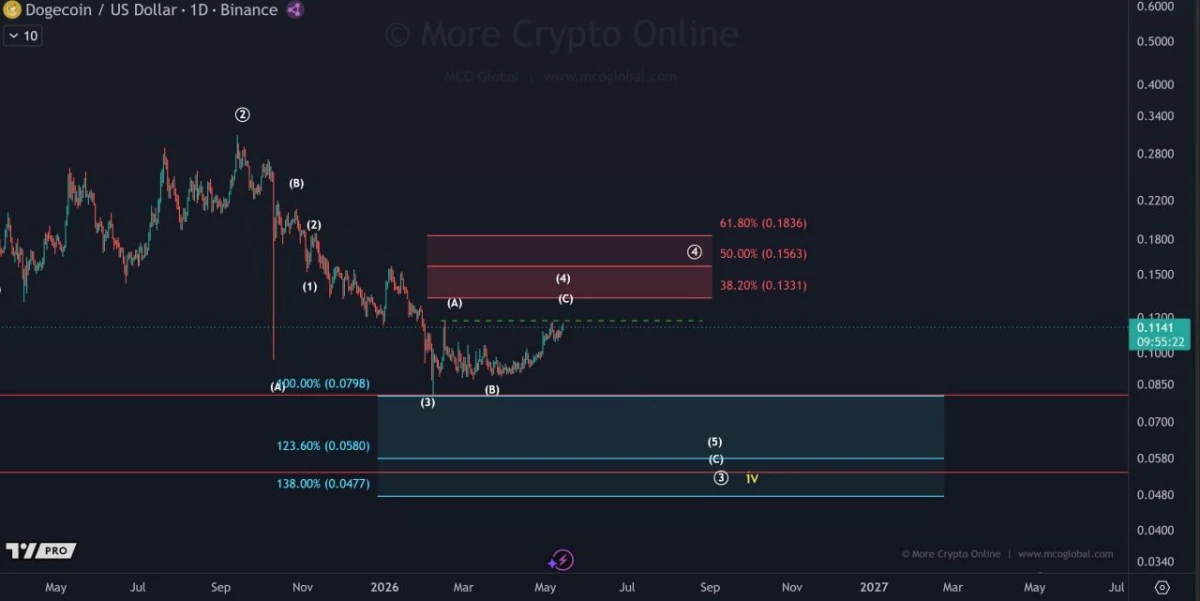
Dogecoin Daily Corrective Recovery Chart. Source: MCO Global on X
However, MCO Global says the move still does not show a clear 5-wave bullish structure. That means the current rise may be a corrective bounce, not a confirmed trend reversal.
The next resistance levels sit near $0.133, $0.156, and $0.183. The $0.133 level is important because it matches the 38.2% retracement zone on the chart.
If $DOGE clears these resistance levels with stronger momentum, the setup could start to shift away from the bearish structure. A clear impulsive breakout would be needed to change the broader view.
For now, support sits near $0.105 and $0.089. If $DOGE loses these areas, the corrective bounce would weaken.
The larger bearish scenario still points to a possible fifth wave decline toward the $0.058 to $0.047 zone over time. That downside setup remains active as long as resistance holds and the recovery stays corrective.