Despite a choppy open, the Solana price today sits near $90.8, squeezed between a constructive daily rebound and a softer intraday tape that could steer the next 3–5 days.
Technical picture
However, positioning dominates: dip buyers have nudged price back above the daily fast averages, while broader crypto breadth is weak and liquidity thin. That leaves Solana in a push–pull; trend followers see a medium-term bounce, while intraday mean‑reverters lean short until $92 is reclaimed.
Daily bias (D1): Neutral, with a constructive tilt
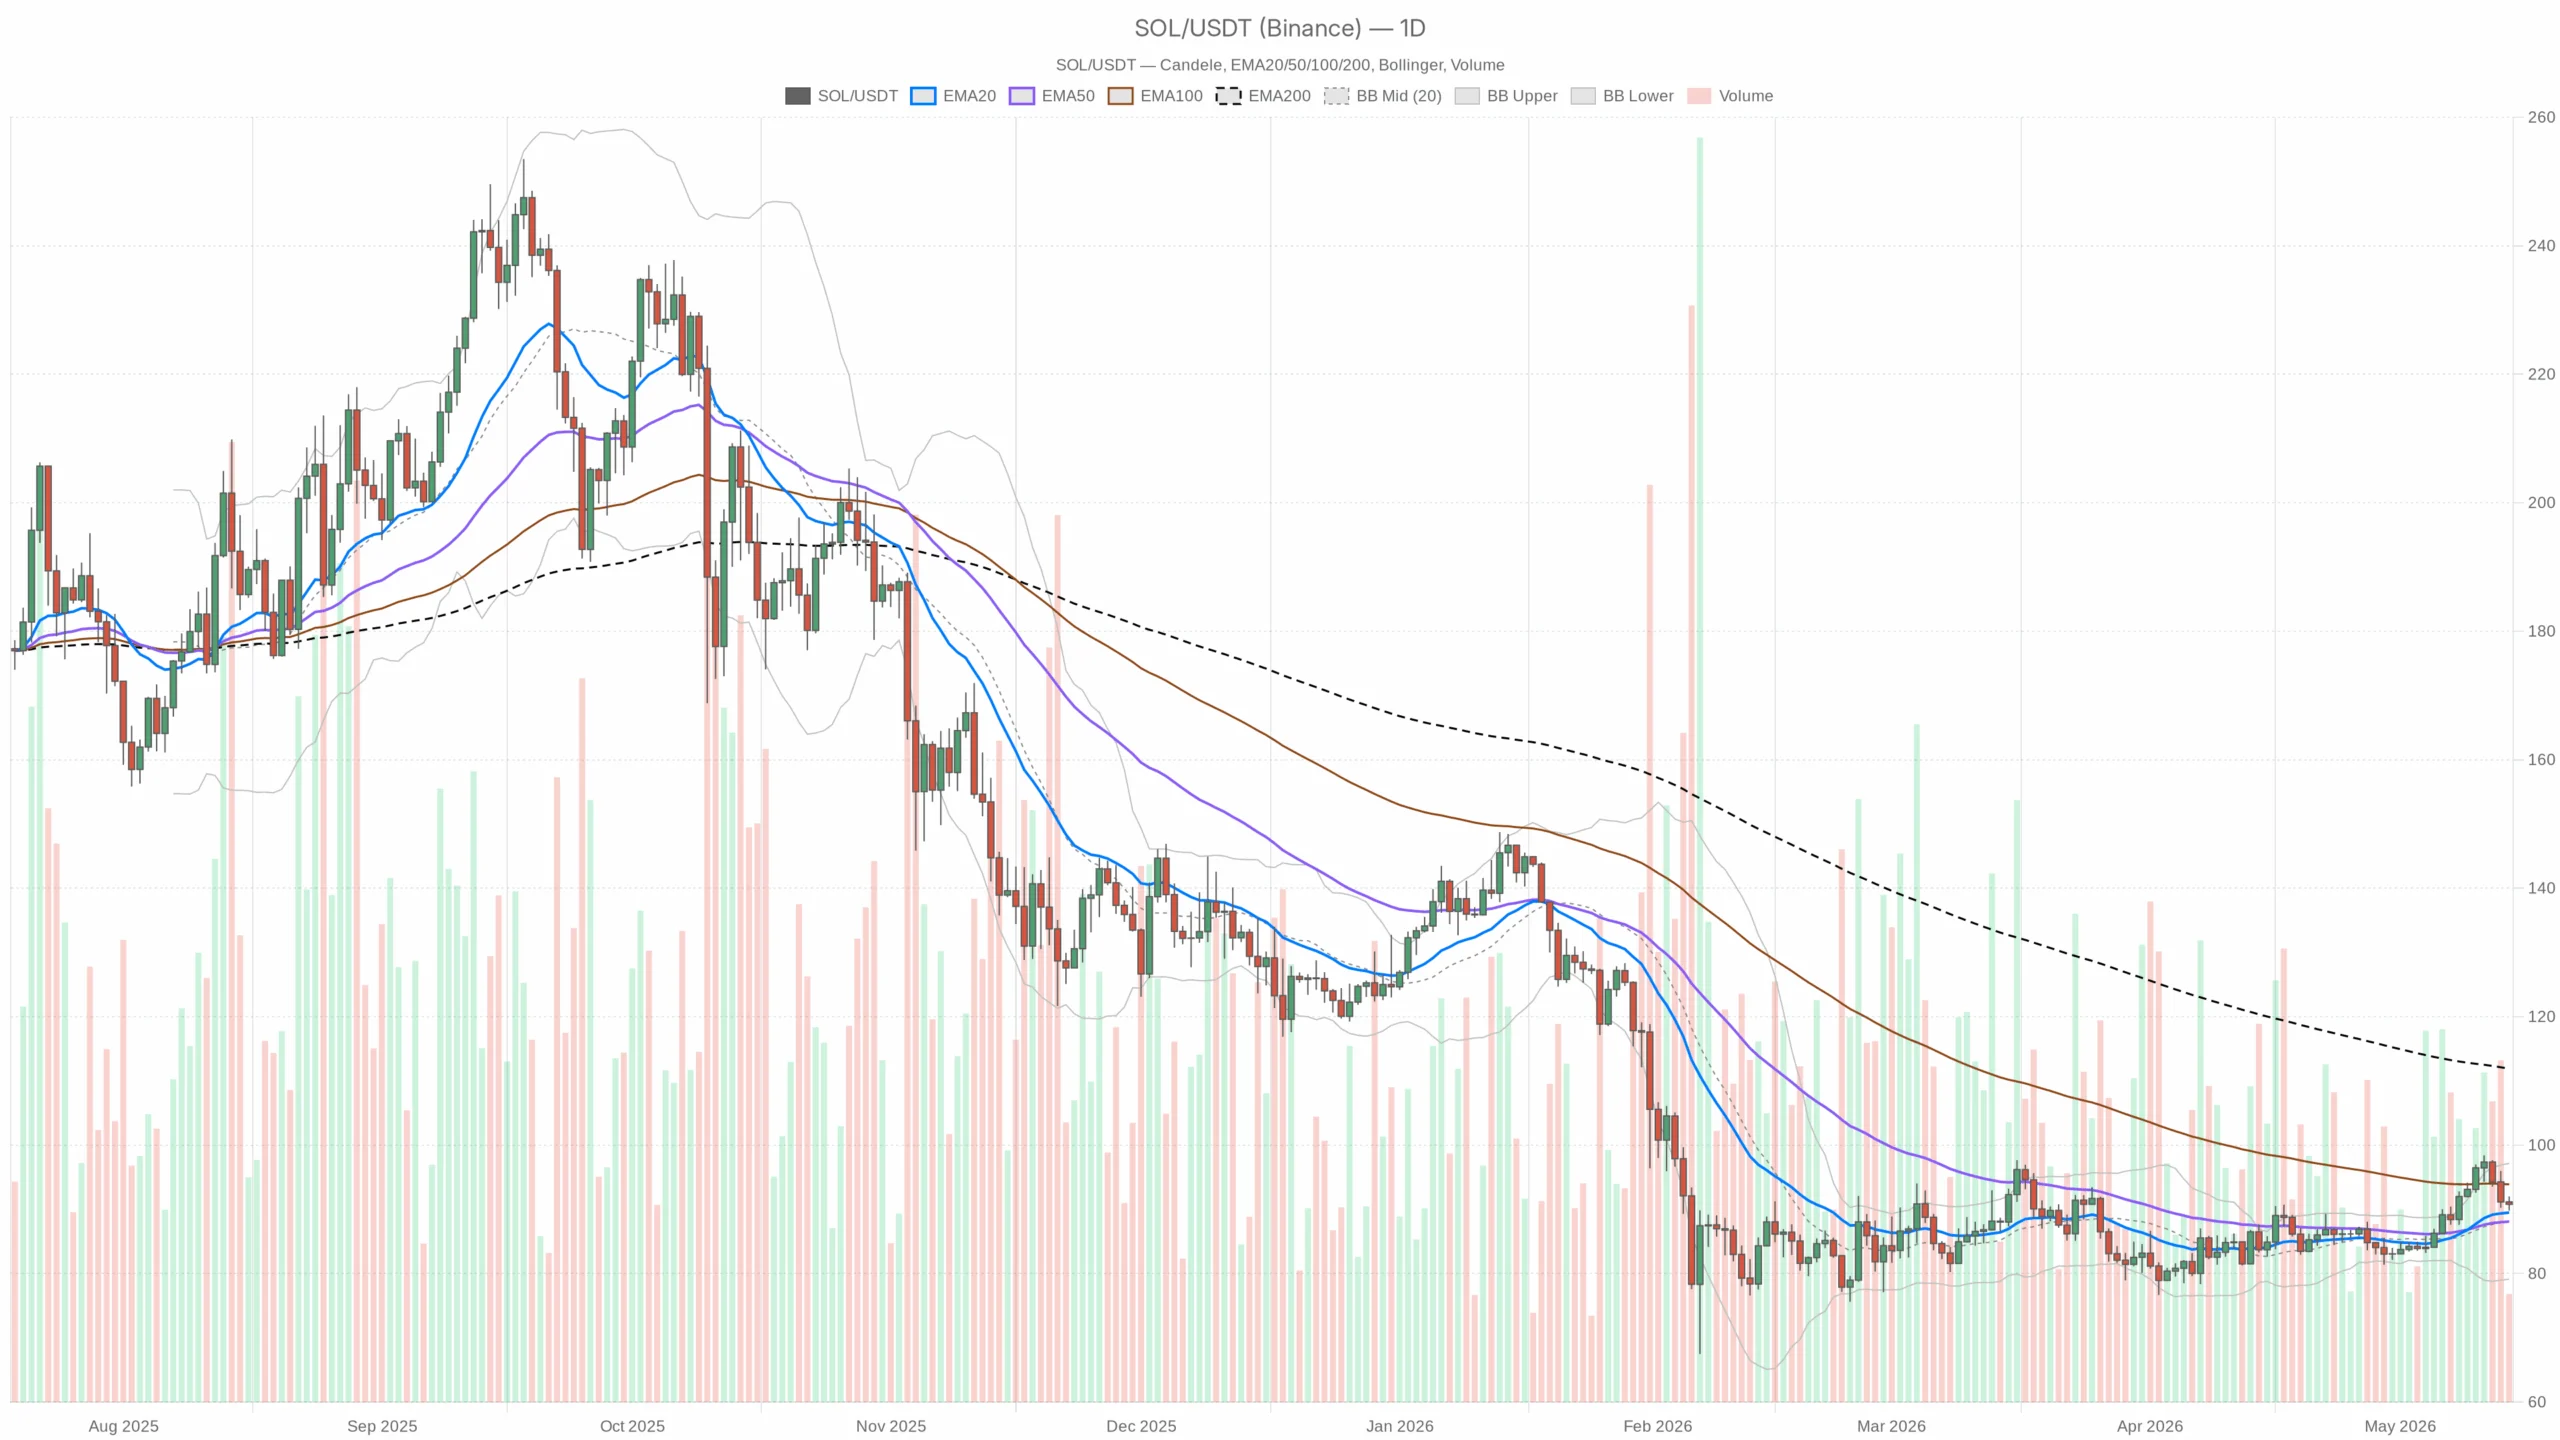
Overall, the daily chart defines the macro bias, and it is neutral: momentum has improved, but the larger downtrend cap has not been cleared.
- EMA (20/50/200): 89.51 / 88.11 / 111.91 — Price at $90.8 sits above the 20/50 but far below the 200; a rebound inside a broader, still-intact higher-timeframe downtrend.
- RSI(14): 54.9 — Mildly bullish; buyers have the initiative but no euphoria.
- MACD: line 2.19 vs signal 1.69 (hist +0.50) — Positive crossover with a small spread; momentum helps, but it is not a runaway move.
- Bollinger Bands: mid 88.16, upper 97.17, lower 79.15 — Trading above the mid-band with room toward 97; upside exists, but it is a range, not a trend.
- ATR(14): 3.22 — Daily swings around 3–4 USD are normal here; expect noise around levels rather than surgical bounces.
- Daily Pivots: PP 90.88, R1 91.94, S1 89.74 — Price is just under PP; a close back above 90.88 improves the daily tone, while a slip under 89.74 hands control back to sellers.
Intraday confirmation (H1): Leans bearish, momentum softening
Meanwhile, the hourly chart is where the tension shows: structure is down, but the push lower is losing energy near support.
- EMA (20/50/200): 91.38 / 92.68 / 91.98 — Price at 90.76 is below all three; bears own the trend unless 92 is reclaimed.
- RSI(14): 38.9 — Pressure remains on the downside; risk of further dips if 90.7 gives way.
- MACD: line -0.68 vs signal -0.83 (hist +0.15) — Bearish but improving; sellers are tiring, opening room for a bounce to test 91–92.
- Bollinger Bands: mid 90.91, upper 91.59, lower 90.23 — Hovering below the mid-band; a mean-reversion pop into 91.0–91.6 is plausible if 90.7 holds.
- ATR(14): 0.63 — Intraday ranges of ~0.6 USD; be ready for quick whips around pivots.
- Hourly Pivots: PP 90.82, R1 90.90, S1 90.67 — Trading just under PP; reclaiming 90.82 flips the very short-term tone, losing 90.67 risks a flush toward 90.2.
Execution lens (15m): Short-term pressure, balanced momentum
That said, the 15-minute is for timing only; it reflects the same pressure but with signs of basing attempts near support.
- EMA (20/50/200): 90.93 / 91.09 / 92.86 — Price at 90.76 remains below; the micro-trend is still down until 90.9–91 is reclaimed.
- RSI(14): 45.5 — Neutral to soft; plenty of room for either a squeeze higher or another leg down.
- MACD: line -0.02 vs signal 0.01 (hist -0.03) — Flat; waiting for a shove from liquidity.
- Bollinger Bands: mid 91.05, upper 91.47, lower 90.62 — Trading near the lower half; a tag of 90.62 is not out of the question before any bounce.
- ATR(14): 0.33 — Fast tape; small misreads can get punished quickly.
- 15m Pivots: PP 90.82, R1 90.90, S1 90.67 — The micro line in the sand remains 90.67; lose it and the path to 90.2 opens.
Market context and flows
Meanwhile, as of 14 May 2026, crypto total market cap is down ~1.5% over 24 hours, with the Fear & Greed Index at 34 and elevated Bitcoin dominance near 58% — a classic risk-off mix for alts. On Solana specifically, DeFi activity is mixed: Orca DEX fees spiked day over day while Raydium cooled. Flows look rotational, not expansive.
Trading roadmap
Bullish scenario: Buyers need to reclaim the daily pivot (90.88) and push through 91.9–92.0 (daily R1 / H1 200 EMA). That flips the hourly trend and validates a continuation toward 93.0–93.5, then 95.0, with stretch potential into the daily upper band near 97.2. This view is invalidated on a daily close back below 89.5 (D1 EMA20) or if 90.67 repeatedly fails and prints lower lows intraday.
Alternatively, bearish scenario: Failure to retake 90.82–91.0 followed by a break under 90.67 puts 89.74 (daily S1) in play. Lose 89.74 and the path opens to 88.2 (daily mid-band/near EMA50 at 88.1), with follow-through risk toward 85.0 and, on an overshoot, the lower band zone around 79–80. This view is invalidated by a sustained reclaim and hold above 92.0 that turns hourly structure higher.
Closing thoughts on positioning
Overall, with Solana price today stuck just under the daily pivot and the hourly trend still down, the base case is neutrality: respect the daily rebound, but do not pay up until 92 is back in hand.
Moreover, given ATR on the daily (~3.2) and hourly (~0.6), position sizes should assume choppy follow-through and false breaks around pivots. In this environment, I’d rather buy strength through 92 with stops defined by hourly structure than knife-catch below 90.7—unless BTC volatility cools and the market’s risk tone improves. Keep one eye on Bitcoin dominance; if it continues to climb, alt rallies will likely be sold.
In sum, the setup skews neutral with clear triggers: reclaim 92 to favor upside extension, or lose 90.67 to reopen 89.74 and 88.2. Respect the tape and let the pivots lead.