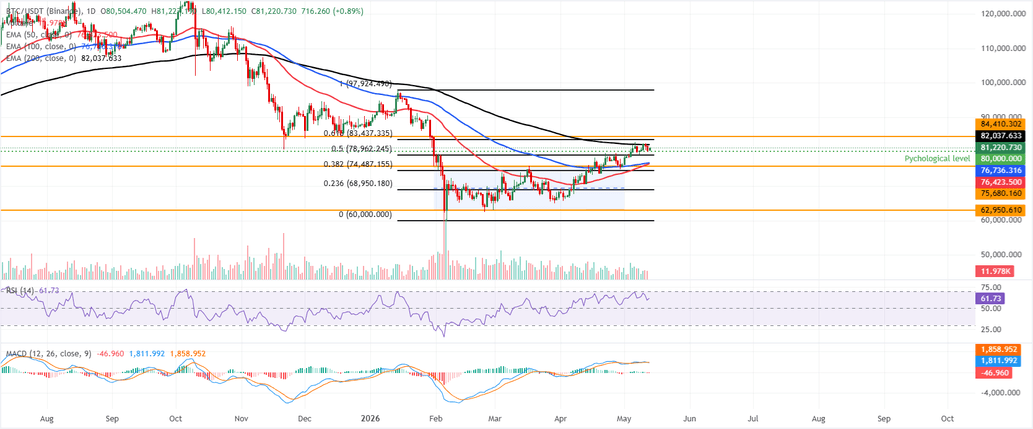
On the topside, immediate resistance emerges at the 200-day EMA around $82,037, with the 61.8% Fibonacci retracement near $83,437 next, ahead of a more substantial horizontal barrier at about $84,410.
On the downside, initial support lies at the psychological $80,000 level, followed by the 50% retracement at $78,962. Then, the 100-day and 50-day EMAs are near $76,735 and $76,421, respectively, with the former channel’s top resistance turned support around $75,680, reinforcing a broader demand band above $74,500.
Ethereum holds firm above key support
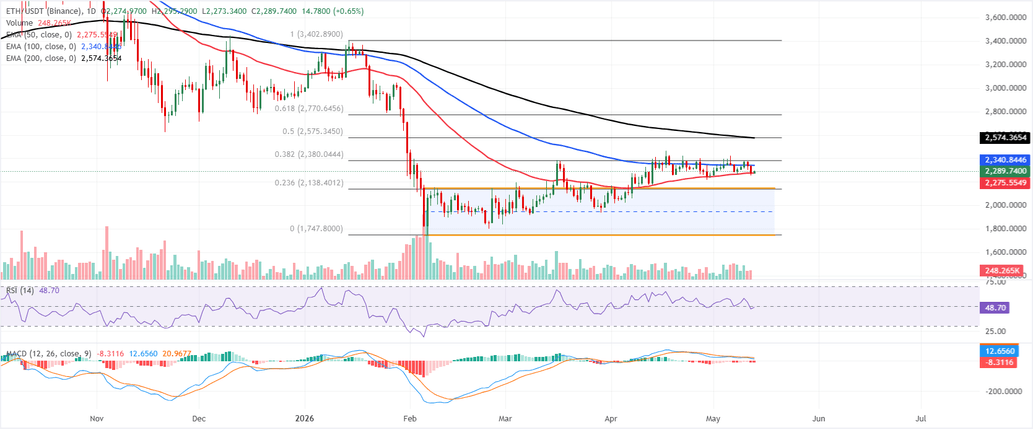
Ethereum trades at $2,289 on Wednesday, maintaining a mildly bearish bias as price holds just above the 50-day EMA at $2,275 while staying capped beneath the 100-day EMA at $2,340.
$ETH also trades below the 38.2% Fibonacci retracement of the latest upswing at roughly $2,380 and remains well under the 200-day EMA around $2,574, suggesting rallies are still meeting overhead supply.
The RSI hovers just below the neutral 50 mark, and the MACD line is below its signal line and below the zero line, with a negative histogram, hinting that upside momentum is fragile despite the recent bounce off short-term support.
On the topside, immediate resistance emerges at the 100-day EMA near $2,340, with the 38.2% Fibonacci retracement at about $2,380 as the next hurdle, while the 200-day EMA around $2,574 marks a broader bearish cap if buyers attempt a stronger recovery.
On the downside, initial support is seen at the 50-day EMA around $2,275, followed by a structural band near the former channel top around $2,148 and the 23.6% Fibonacci level at roughly $2,138; a sustained break below that zone would expose the channel base and major swing floor around $1,748, where medium-term buyers could look to re-enter.
$XRP could extend gains if it breaks above the descending channel pattern
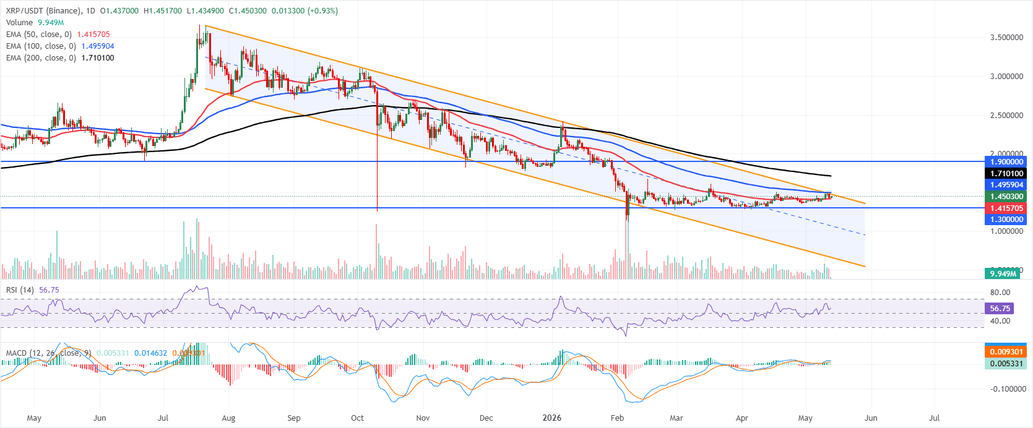
$XRP price trades at $1.45 and holds above the 50-day EMA at $1.41, suggesting tentative near-term support, but remains capped within a broader downward parallel channel and below the 100-day and 200-day EMAs at $1.4959 and $1.7101, respectively, which keeps the broader tone only mildly constructive.
The RSI is around 56, and a slightly positive MACD reading hints at improving momentum, yet buyers still need to clear nearby overhead levels to strengthen the bullish case.
On the topside, initial resistance emerges at the channel’s upper boundary near $1.47, followed by the 100-day EMA at $1.49, while the 200-day EMA at $1.71 and the horizontal resistance around $1.90 form a more distant supply zone within the broader downtrend.
On the downside, immediate support is seen at the 50-day EMA around $1.41, with the horizontal floor at $1.30 acting as the next key level; a deeper pullback toward the channel bottom near $0.65 would only come into focus if these supports give way.
(The technical analysis of this story was written with the help of an AI tool.)

 fxstreet.com