
Solana ($SOL) price rebounds, finding support around the key technical level near $94 on Wednesday. Strong institutional demand, with spot $SOL Exchange Traded Funds (ETFs) recording inflows for the seventh consecutive day, hints at a potential rally ahead. Meanwhile, improving sentiment among traders in the derivative markets also projects a bullish bias for Solana.
Strong institutional demand for $SOL
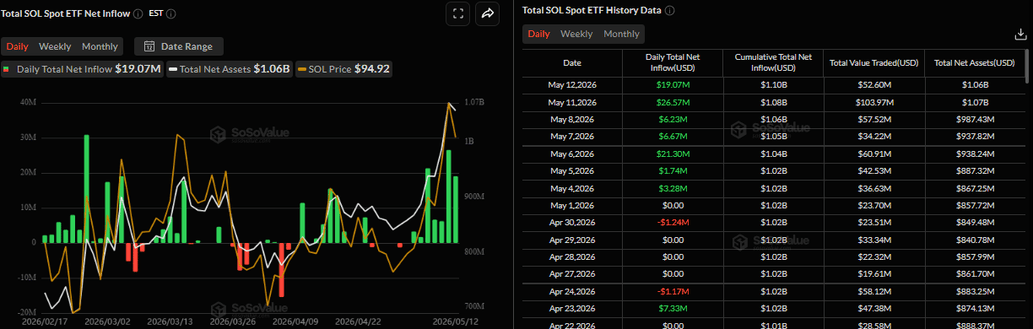
Institutional demand has remained strong so far this week. SoSoValue data shows that spot Solana ETFs recorded inflows of $19.07 million on Tuesday, after $26.57 million the previous day. Tuesday’s inflow marks the seventh consecutive day of positive flows since May 4. If this inflow continues and intensifies, $SOL could see an upside move ahead.
Derivatives data flips bullish
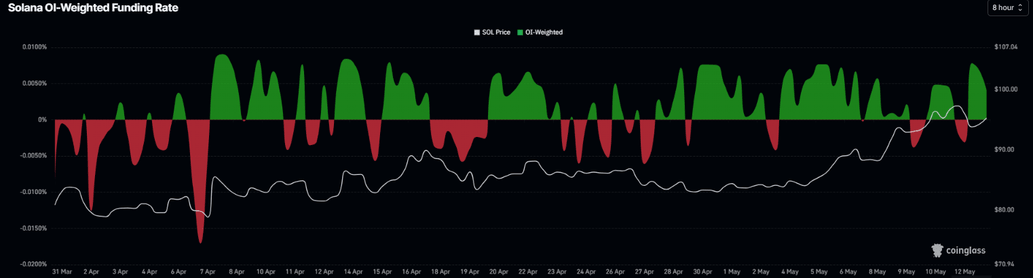
On the derivatives side, metrics also support a positive bias. Solana’s funding rates flipped positive on Tuesday and surge to 0.0041% on Wednesday, indicating that longs are paying shorts, supporting a bullish sentiment among traders.

CoinGlass’ long-to-short ratio for Solana read 1.06 on Wednesday, nearing the highest level over a month. This ratio, being above one, reflects bullish sentiment in the market, as more traders are betting on the asset price to rally.
Solana Price Forecast: $SOL key support holds
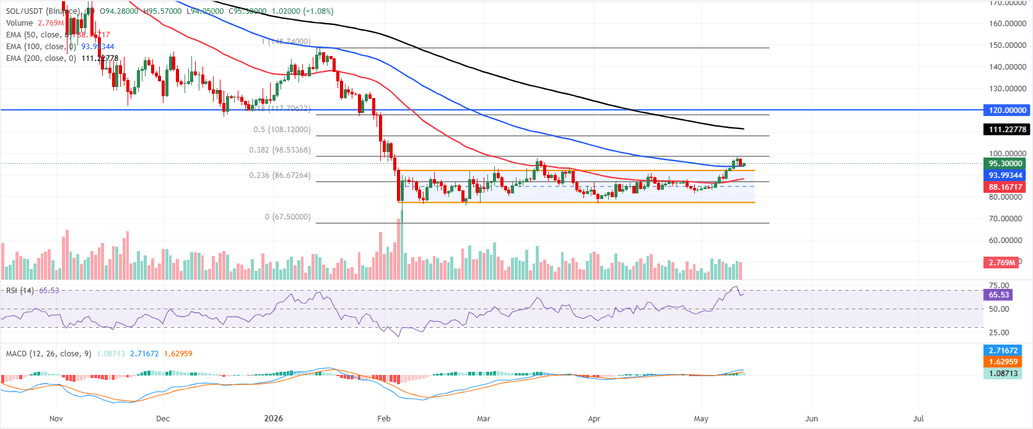
Solana price is trading at $95.30, rebounding slightly on Wednesday. $SOL is holding a constructive bullish bias as it extends above the 100-day Exponential Moving Average (EMA) at roughly $93.99 and the 50-day EMA near $88.17.
Solana price has broken out over the top of its parallel channel around $92.11, suggesting a short-term shift from consolidation to recovery. At the same time, the Relative Strength Index (RSI) is near 65 points to firm but not yet overbought bullish momentum, reinforced by a positive Moving Average Convergence Divergence (MACD) reading above zero.
On the topside, initial resistance emerges at the 38.2% Fibonacci retracement of the latest swing around $98.53, ahead of the $108.12, its 50% retracement and the 200-day EMA clustered near $111.23, with a more substantial barrier at the horizontal resistance zone and 61.8% Fibonacci retracement between about $117.71 and $120.00.
On the downside, immediate support is provided by the 100-day EMA at $93.99 and the prior channel ceiling around $92.11, followed by the 50-day EMA at $88.16 and the 23.6% Fibonacci retracement near $86.67, with deeper cushions at the lower channel boundary around $77.12 and the structural swing low close to $67.50 if the current advance unwinds.
(The technical analysis of this story was written with the help of an AI tool.)