Solana is testing the $95–$96 resistance area after breaking a short-term descending trendline. Traders are watching whether $SOL can hold above nearby support and build enough momentum for a move back above $100.
Solana Reaches $95–$96 Zone as Traders Watch Micro Support
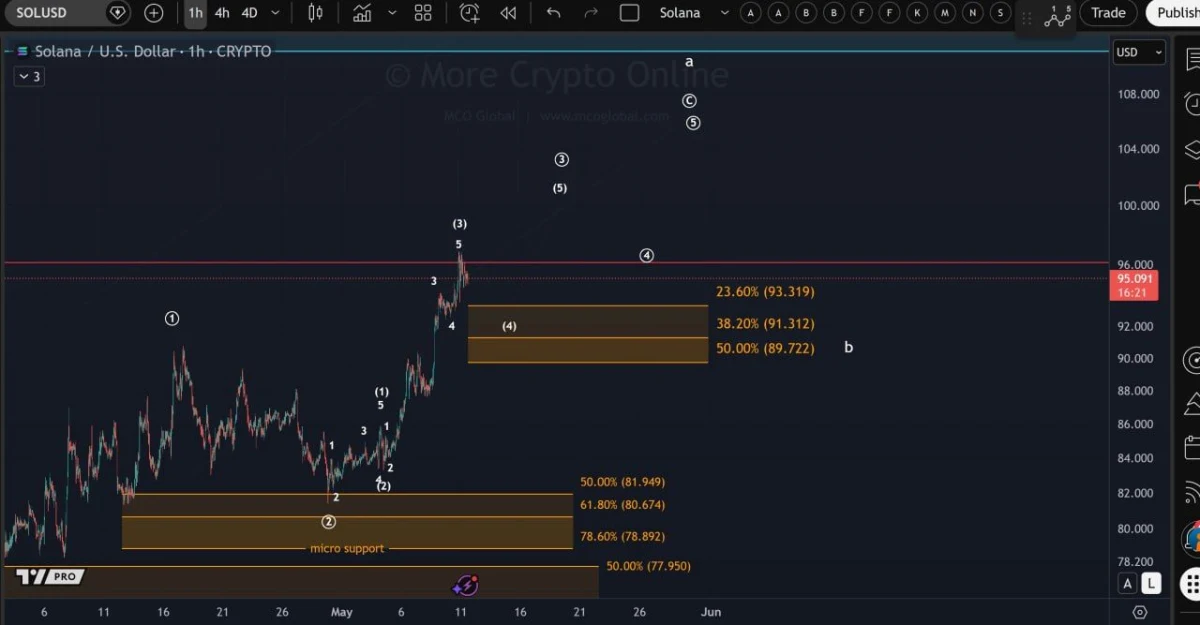
Solana has reached the $95–$96 resistance area, according to a chart shared by More Crypto Online. The setup shows $SOL following the expected short-term path after moving higher from its micro support base.
Solana Micro Support Setup. Source: More Crypto Online on X
The chart shows $SOL rising from the lower support area near $78.89–$81.94 before pushing into the current resistance zone. Price is now testing the red horizontal level around $96, which marks a key area for the next short-term move.
More Crypto Online said Solana is “following the plan” and noted that the price has reached the $95–$96 area. The analyst also marked micro support between $89.72 and $93.32, which now acts as the main zone to hold.
If $SOL stays above this support range, the upside structure remains active. The chart points to possible continuation toward higher wave targets above $100, with levels near $104 and $108 shown on the right side.
However, Solana still needs to hold the $89.72–$93.32 zone to keep momentum intact. A move below this area would weaken the short-term setup and could send price back toward the wider support region near $80–$82.
For now, traders are watching whether $SOL can break above $96 or pull back into the marked micro support zone first. A clean move above resistance would show stronger buyer control, while a support loss would delay the bullish setup.
Solana Breaks Short-Term Trendline as Traders Watch Move Back Above $100
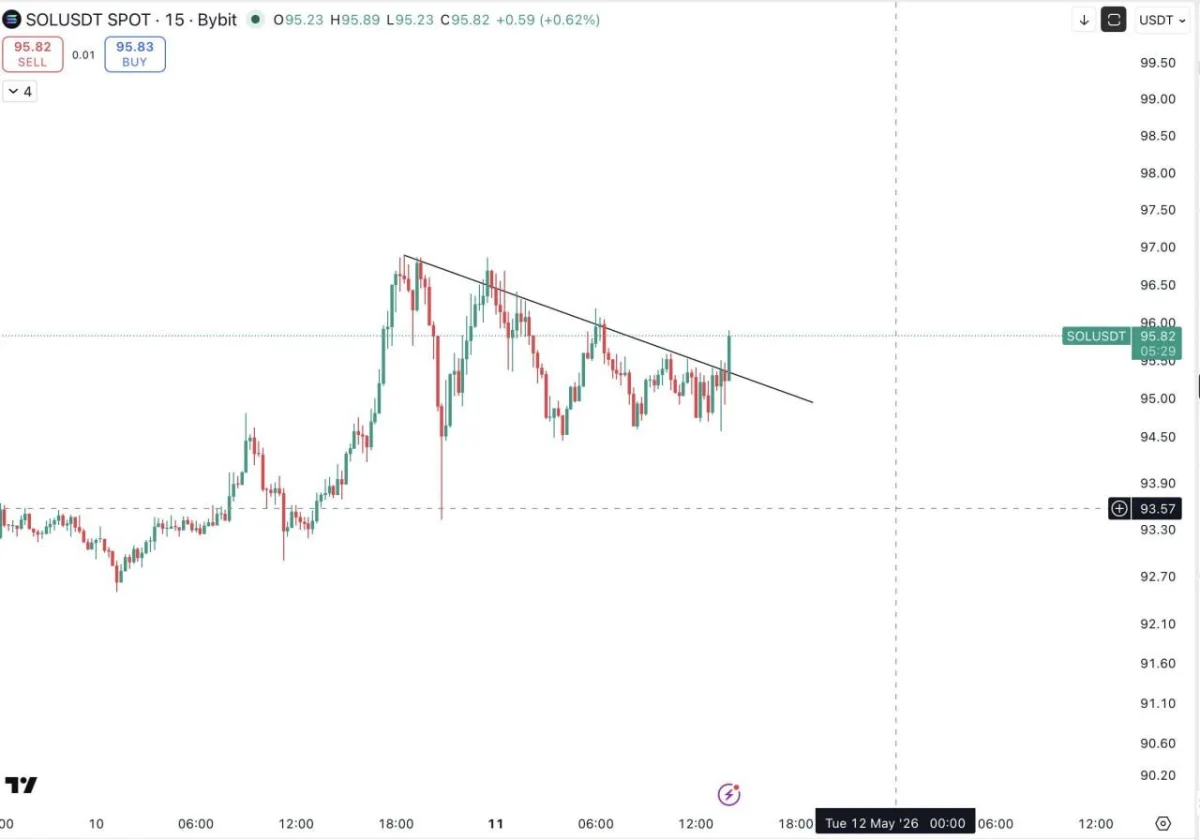
Solana has broken above a short-term descending trendline on the 15-minute chart, according to a setup shared by The Cryptomist. The move shows $SOL trying to regain momentum after a brief consolidation below the $96 area.
Solana Short-Term Trend Break. Source: The Cryptomist on X
The chart shows $SOL moving higher earlier in the session before price started forming lower highs. That structure created a short-term downward trendline, which capped several breakout attempts.
The latest candle moved above that trendline, showing a possible shift in short-term momentum. This type of break can point to renewed buyer strength, especially when price holds above the broken trendline after the move.
The Cryptomist said Solana had a smaller-time-frame trend break. The analyst added that if Bitcoin holds its current structure, $SOL could move back above $100 from this area.
The $96 zone now acts as the first area to watch. A clean hold above it could support a move toward $98 and then the $100 level. However, $SOL still needs follow-through, as short-term trendline breaks can fail if buyers do not keep control.
If $SOL falls back below the trendline, the setup would weaken. In that case, traders may watch the $95 and $93.57 areas as nearby support levels before any new upside attempt.