
$XRP is sitting at an important inflection point, and this Ripple crypto analysis shows a market that has recovered from weaker conditions without fully repairing its broader structure.
Daily timeframe: neutral with a bullish lean
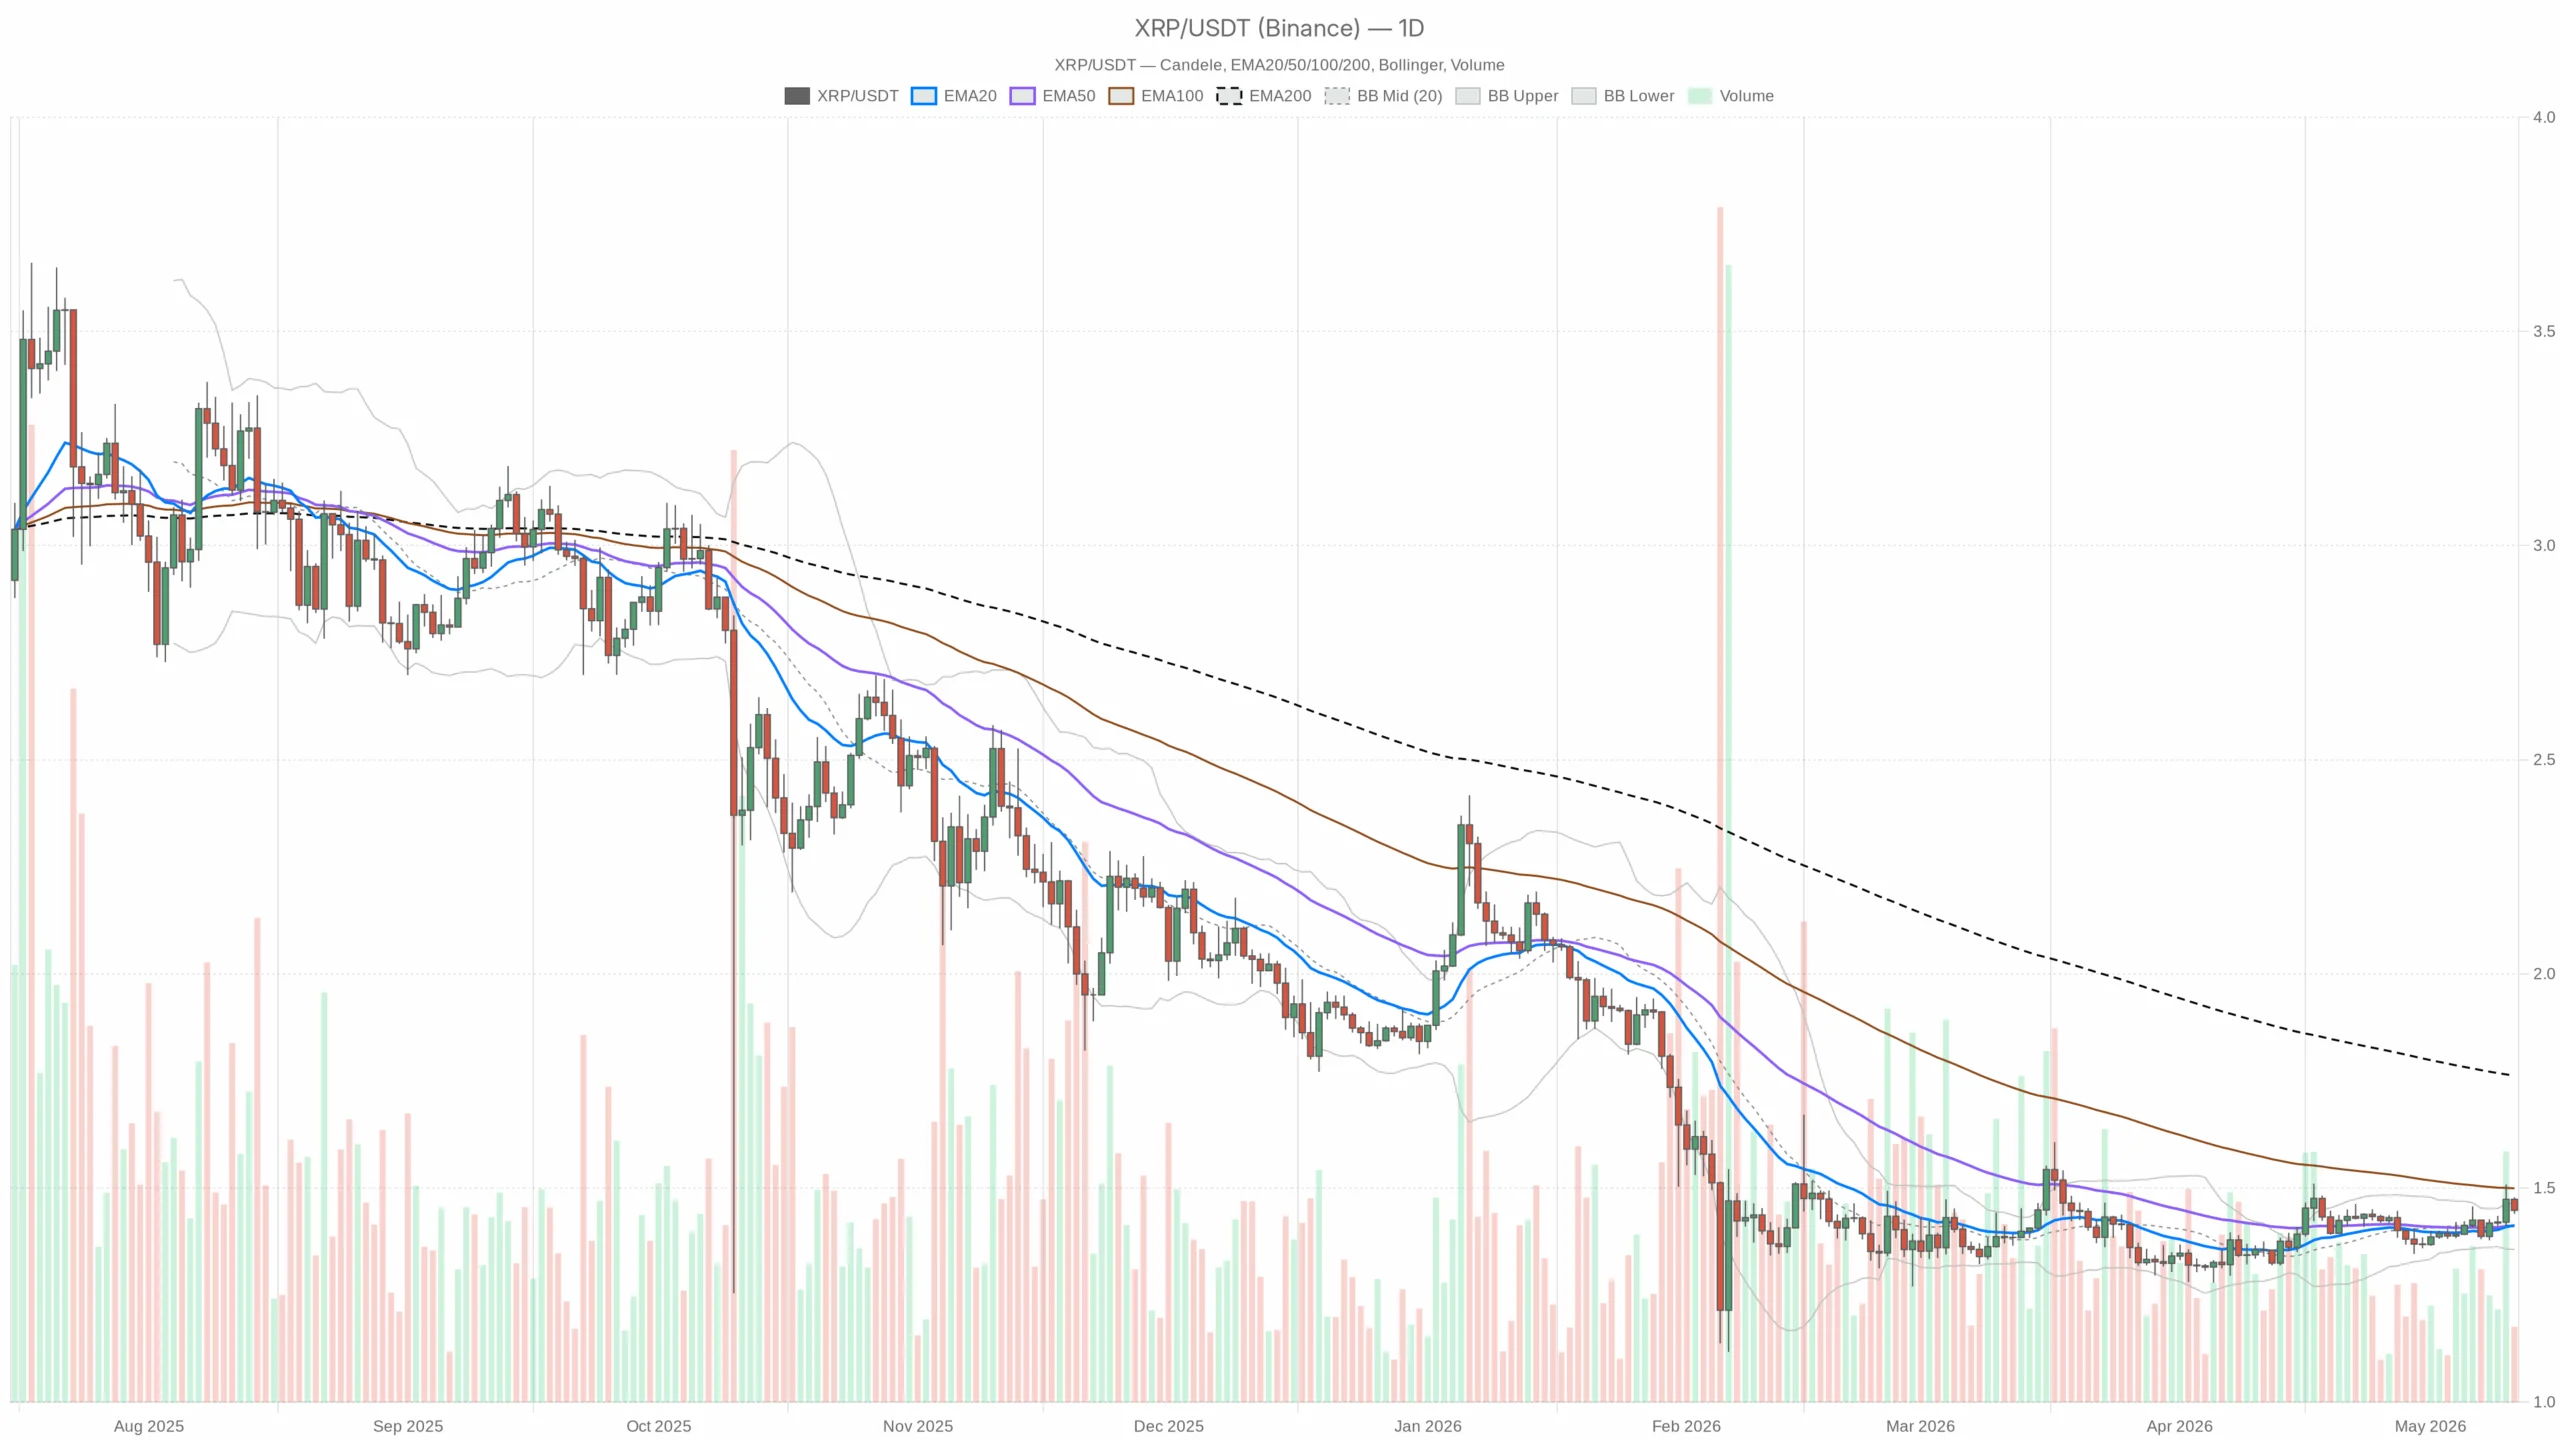
$XRP is trading at 1.45 on the daily chart, above its short- and medium-term trend gauges, but still well below the 200-day EMA at 1.76. That tells you the market has recovered from weaker conditions, yet it has not fully repaired the broader structure.
Right now, the dominant force is balance rather than expansion. Buyers have defended price above the daily mean, but they have not delivered the momentum that usually starts a sustained breakout leg.
Moreover, $XRP is pressing close to daily resistance while the broader crypto market is not offering a strong directional tailwind. Bitcoin dominance remains elevated near 58.2%, and overall market cap growth over the last 24 hours is almost flat.
In other words, the backdrop is not outright hostile, but it is not the kind of environment where altcoins usually run freely either. For $XRP, that leaves price action heavily dependent on whether buyers can force acceptance above the current ceiling or whether this zone turns into another rejection point.
The main scenario on the daily chart is neutral, but with a mild upward bias. $XRP is above both the 20-day EMA and the 50-day EMA, and both sit around 1.41, while price is holding at 1.45.
That is constructive. It shows the market has stabilized and is trading slightly above its recent value area. However, the 200-day EMA at 1.76 is still far above current price, which means the bigger picture has not fully turned bullish yet.
For now, $XRP looks more like a market trying to build a base than one already in a clean trending advance. The daily RSI at 57.4 supports that view.
It is above the neutral 50 line, so buyers have a slight edge, but it is nowhere near overheated territory. In plain terms, momentum is positive enough to keep the recovery alive, but not strong enough to prove that buyers are in full control.
The daily MACD is barely positive, with the line and signal both near 0.01 and a small positive histogram. That is a modest sign of improving momentum, not a decisive surge.
It tells you the market is leaning upward, but without conviction. When MACD looks like this, breakouts tend to need confirmation rather than blind trust.
Bollinger Bands on the daily chart reinforce the same message. The mid-band is at 1.41, the upper band at 1.47, and $XRP is trading at 1.45.
Price is above the middle band and leaning toward the upper band, which usually points to mild bullish pressure. Still, sitting just under the upper band also means $XRP is already pressing into a short-term expansion zone.
If buyers cannot push through quickly, the market can easily slip back into range behavior. ATR on the daily chart stands at 0.04, which implies moderate volatility.
$XRP is moving enough to create opportunity, but not enough to call this a high-conviction directional phase. The market is active, though still controlled rather than explosive.
The daily pivot structure is tight and important here. The pivot point is 1.46, resistance at 1.47, and support at 1.43.
With price at 1.45, $XRP is trapped right around the equilibrium zone. That usually means the next clean move above 1.46-1.47 or below 1.43 matters more than the candles inside this pocket.
1-hour timeframe: momentum has cooled
The hourly chart weakens the bullish case a bit. $XRP is trading at 1.45, right on top of the 20-hour EMA at 1.45, slightly above the 50-hour EMA at 1.44, and comfortably above the 200-hour EMA at 1.42.
Structurally, that is still decent. The short-term trend has not broken down. However, the slope is flattening, and that usually means the market is pausing rather than pressing.
The hourly RSI is 49.31, almost perfectly neutral. That tells you momentum has cooled off and neither side has a clear short-term edge.
Buyers are no longer pushing; sellers are not taking over either. It is a classic consolidation reading.
The hourly MACD is flat, with the line at 0, the signal at 0.01, and histogram at 0. That confirms the loss of short-term momentum.
In practice, this Ripple crypto analysis points to a market that is not showing the kind of acceleration that would make a daily upside break feel imminent.
The hourly Bollinger Bands run from 1.42 to 1.50 with a mid-line at 1.46, and $XRP is sitting just below the middle. That leaves room in both directions and fits the idea of a market stuck in a local range.
Price is neither stretched nor washed out. Hourly ATR is 0.02, which points to contained intraday volatility.
This usually favors tactical trading rather than aggressive trend chasing. The hourly pivot point is 1.45, with resistance also effectively around 1.45 and support at 1.44.
That is about as compressed as it gets. The market is balanced, and balanced markets often stay dull until one side forces a break.
15-minute timeframe: execution only, not direction
The 15-minute chart is useful only for timing, and right now it adds very little directional conviction. $XRP is at 1.45, with the 20-period EMA and 50-period EMA both at 1.45 and the 200-period EMA at 1.44.
That means price is sitting in a very tight short-term cluster, where noise can easily look like signal. The 15-minute RSI is 42.87, which tilts slightly soft.
That tells you intraday momentum is a bit weaker, but not decisively bearish. It looks more like hesitation than active selling pressure.
The 15-minute MACD is flat at zero, confirming there is no real short-term impulse in play. In a market like this, forcing entries tends to be more expensive than waiting.
Moreover, Bollinger Bands on this timeframe are extremely narrow, between 1.44 and 1.46, with price right at the mid-band. That is classic compression.
Usually, compression precedes movement, but it does not tell you the direction by itself. The 15-minute ATR is effectively negligible, which is another way of saying short-term volatility is compressed.
The pivot area is also centered at 1.45, with support at 1.44. So for execution, this is a wait-for-break market rather than a chase-the-middle market.
Indicator evidence, in plain market terms
RSI: Daily RSI at 57.4 keeps $XRP slightly on the front foot, but the hourly RSI near 49 and the 15-minute RSI below that show momentum has faded as price approached resistance.
The bigger picture is constructive, but the shorter timeframes are not confirming acceleration. That mismatch is important because it often leads either to a delayed breakout or a pullback into support.
MACD: Daily MACD is just positive, which supports the idea of a recovery phase still alive. But hourly and 15-minute MACD readings are flat, so there is no immediate follow-through.
In practical terms, the daily chart says buyers are still in the fight, while the intraday charts say they are not pressing the advantage yet.
EMA structure: On the daily chart, trading above the 20 and 50 EMAs is encouraging, but the distance below the 200 EMA keeps the broader trend from becoming convincingly bullish.
On the hourly chart, $XRP remains above the 200 EMA, which means the short-term structure is still intact. The market is firm, but not fully trending.
Bollinger Bands: Daily price sitting near the upper band shows $XRP is leaning into resistance rather than breaking away from it. On lower timeframes, band compression points to a pending move.
The problem is that compression without momentum can break either way. ATR: Daily ATR at 0.04 and hourly ATR at 0.02 show $XRP has enough movement to matter, but volatility is not yet expanding in a way that usually validates a trend extension.
That means the next directional move still needs proof. Pivot levels: Daily PP at 1.46, R1 at 1.47, and S1 at 1.43 define the key battlefield.
$XRP is trading just below that pivot-resistance cluster, which is why this zone matters so much. Hold above 1.46-1.47 and the chart starts to look more constructive. Lose 1.43 and the market likely drifts back into defensive mode.
Bullish scenario
The bullish case is straightforward: $XRP reclaims and holds above 1.46 and then pushes through 1.47 with hourly confirmation. If that happens, the daily chart would start resolving higher from a base above the 20-day and 50-day EMAs.
Then, the current pause would look more like consolidation before continuation. For that view to gain credibility, the hourly RSI needs to lift back above 50 and MACD needs to turn positive again.
Without that intraday confirmation, upside breaks remain vulnerable to failure. The bullish scenario would be invalidated by a rejection from the 1.46-1.47 area followed by a loss of 1.43.
That would tell you buyers could not defend the breakout zone and that the daily recovery is losing traction.
Bearish scenario
The bearish case starts if $XRP slips below 1.43 and begins accepting price back under the daily pivot area. That would put price back into a weaker rotational structure and expose the 1.41 zone, where the daily 20 EMA and 50 EMA currently sit.
If that area gives way, the market would look much more like a failed rebound than a healthy consolidation. The softer 15-minute RSI and flat hourly momentum are not bearish on their own, but they leave the door open for exactly that kind of slip if buyers stay passive.
The bearish scenario would be invalidated by a clean move above 1.47 that holds on retests. If $XRP can do that, sellers lose their near-term control point and the market likely rotates higher instead of lower.
Bottom line
$XRP is not in a clean trend right now. The daily chart has improved, and that matters, but the shorter timeframes are not backing a decisive move yet.
So this is a market where positioning should respect the tension: the structure is better than it was, but momentum is still too soft to treat resistance as already broken. For traders, this is less about prediction and more about reaction.
Above 1.47, $XRP starts to look like a breakout candidate. Below 1.43, it starts to look like a failed recovery. Between those levels, the market is balanced, volatility is contained, and uncertainty is still part of the trade.