
Jupiter [$JUP] posted a 23% gain, making it one of the strongest-performing assets in the broader crypto market over the past trading session.
Market analysis shows that growing Spot accumulation and rising perpetual trading activity continue to support the possibility of further upside momentum.
However, liquidity positioning across the market suggests the rally may still face limitations, with upside expansion likely to remain capped unless stronger demand enters the market.
Spot accumulation continues to support the rally
The recent rally has largely been driven by structural strength in the Spot market. The chart below shows increased Spot buying activity, which has continued to provide support for $JUP’s upward move.
According to CoinGlass exchange netflow data, the market recorded roughly $577,000 in Spot accumulation over the past 24 hours.
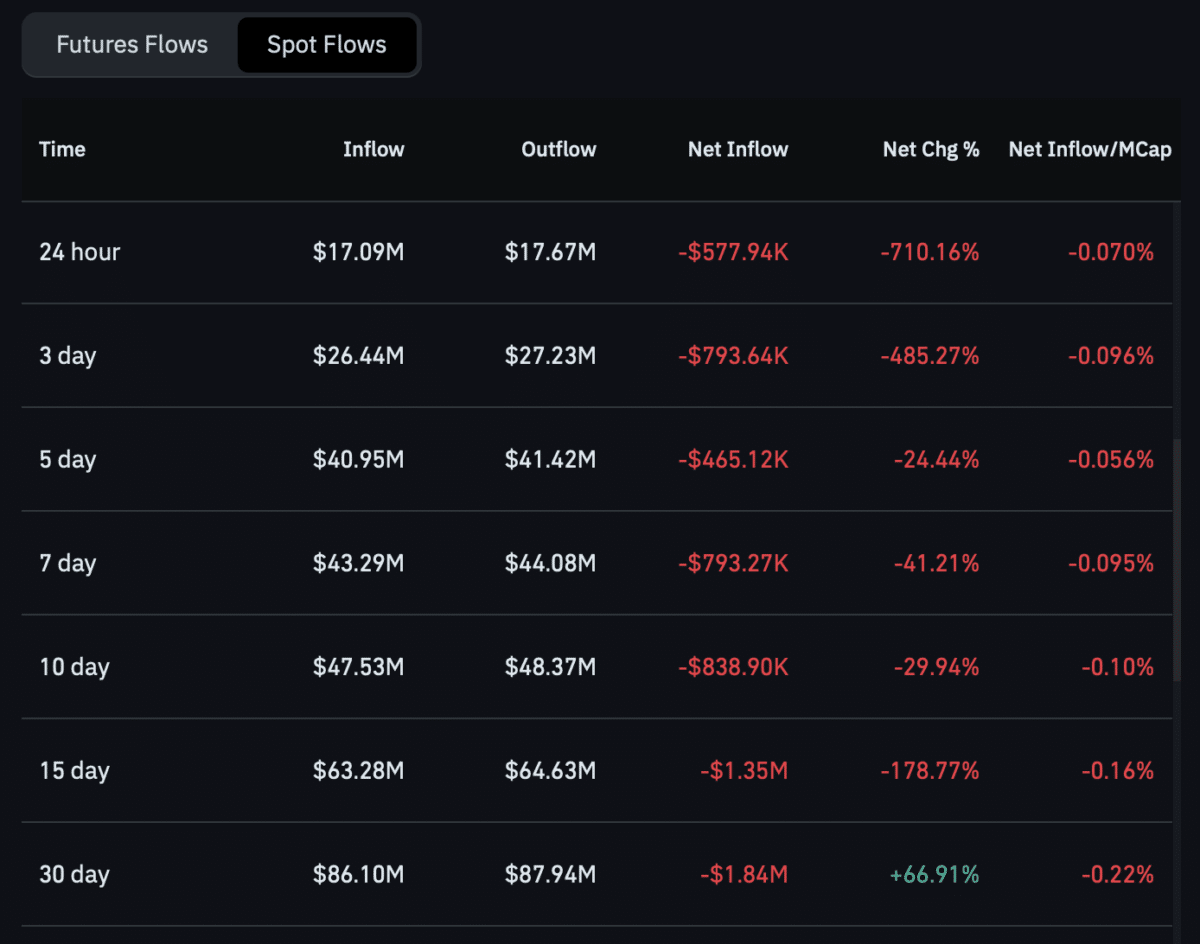
On a broader timeframe, netflows over the past 30 days reached approximately $1.84 million, highlighting moderate but sustained accumulation activity.
The persistent negative exchange netflow suggested that investors continued moving $JUP off exchanges and into private wallets. This trend is often viewed as bullish because it reduces the likelihood of immediate sell pressure entering the market.
Perpetual market activity drives bullish sentiment
A significant portion of the current bullish momentum has also been driven by increased activity in Jupiter’s perpetual Futures market.
CoinGlass data shows that Open Interest (OI) climbed by more than 22% in the past day, reaching approximately $67.26 million.
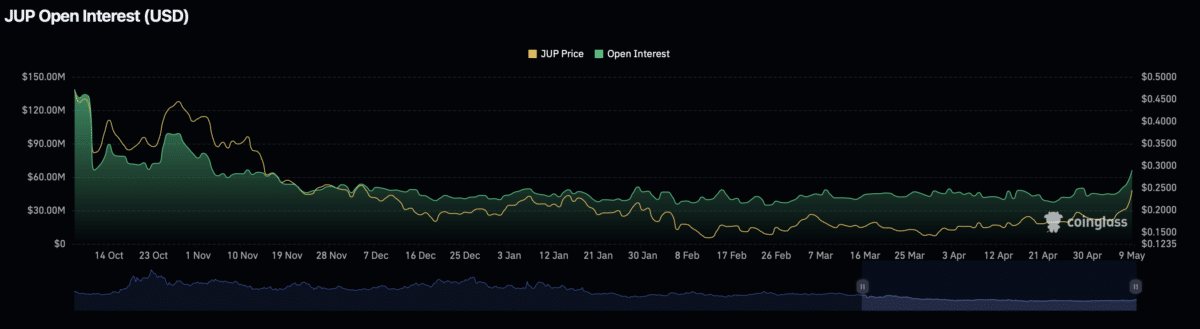
The latest increase pushed OI to its highest level since February 2026, signaling renewed speculative participation in the market.
At the same time, the positive OI-Weighted Funding Rate confirms that long traders continue to dominate positioning in the perpetual market, with the metric holding near 0.0140%.
While the broader setup remains supportive of further upside, derivatives volume data continues to reflect some caution.
The Taker Buy/Sell Ratio still leans toward sellers, indicating that sell-side trading volume remains elevated despite rising bullish positioning.
This divergence suggests that although traders continue opening long positions, selling activity has not fully weakened, leaving room for short-term volatility to persist.
Liquidity clusters could limit further upside
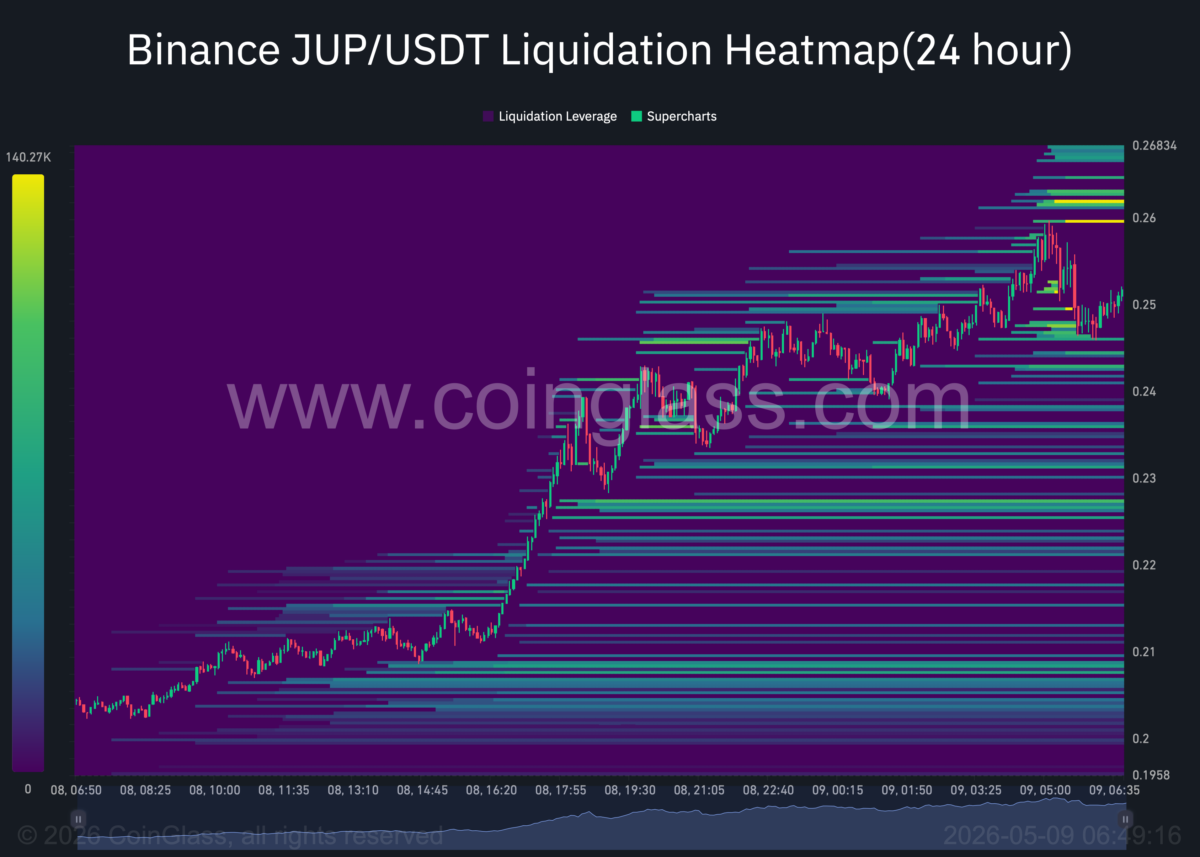
Despite the strong rally, liquidity cluster positioning suggests $JUP could face resistance near the $0.20 region.
The chart shows multiple unfilled liquidity zones, which often act as price magnets and influence short-term market direction.
These clusters indicate that the current rally may struggle to expand aggressively without stronger Spot demand.
Additional liquidity clusters positioned below the current market price also suggest downside pressure has not fully disappeared.
This leaves open the possibility of a pullback even as momentum indicators continue to favor long traders.
Although selling pressure has eased compared to previous sessions, the presence of lower liquidity clusters still highlights lingering downside risks, keeping caution firmly in focus despite the market’s bullish structure.
Final Summary
- $JUP continues to attract steady Spot market demand, while capital inflows into the perpetual market keep rising.
- Liquidity clusters suggest the upside rally could remain limited, even as downside risks continue to linger.