
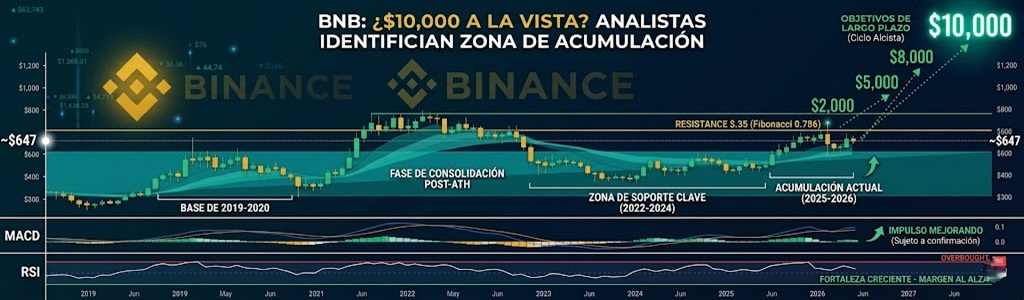
- The $BNB price currently stands around $647, facing immediate technical resistance at the $678 level.
- Market analysts identify a historical accumulation range situated between $300 and $600 as a base for potential bullish moves.
- The MACD and RSI technical indicators show early recovery signals, although the asset remains below critical Fibonacci retracement levels.
This Wednesday, May 6, the native token of the Binance ecosystem, $BNB, came close to touching $647 after experiencing a correction from its previous highs. Market data indicates that the asset is in a technical consolidation phase while investors assess the strength of a support zone that defined price behavior in previous cycles.
One Day You'll Scroll Back to This Post And Wish You Listened$BNB between $600–$300 is the zone nobody is talking about… until it's too late.
Every Past Accumulation Zone Delivered Life-Changing Returns:
🟣 2019 Zone → +660%
🟣 2020–21 Zone → +11,200%
🟣 2025–26 Zone →… pic.twitter.com/8viHuBuSkU— Crypto Patel (@CryptoPatel) May 6, 2026
Analysis of the Accumulation Zone and Price Projections
Traders focused on the range between $300 and $600. According to technical reports shared on social networks and analysis platforms, this band presents itself as a potential long-term accumulation zone. This perspective is based on comparisons with historical cycles; for example, market history recalls that after similar phases in 2019, the asset recorded a move of 660%, while in the 2020-2021 period the increase exceeded 11,000%.
With the current trend, some analysts suggest that if this structure holds, ambitious targets could be projected. According to these estimates, the price could seek levels of $2,000, $5,000, and even $10,000 over an extended horizon. However, the report highlights that reaching such figures would require a substantial increase in global demand and a structural change in the total crypto market capitalization.
Fibonacci Levels and Critical Supports
On the daily chart, the $BNB price sits below the 0.786 Fibonacci retracement level, located at $678.35. Technical data indicates that this zone from $678 to $680 is the great wall for buyers. A confirmed breakout above this level could, according to technical projections, open the way toward $801, corresponding to the 0.618 Fibonacci level.
Beyond $801, the next relevant resistance is located near $888. For the asset to recover this ground, it is projected that constant trading volume and a favorable climate in the rest of the sector will be necessary.
In the bearish scenario, immediate support has been established between $600 and $620, where the price has managed to build a base in recent sessions. If this support is breached, indicators suggest that the next important line of defense for the bulls lies at $521.
Momentum Indicators and Recovery Signals
The Moving Average Convergence Divergence (MACD) oscillator is currently situated above the signal line. At the same time, the histogram has begun to show positive values in the last 24 hours, indicating an improvement in short-term momentum.
For its part, the Relative Strength Index (RSI) is positioned at 62 points. According to technical analysis, this figure reflects growing strength but keeps the asset below the overbought zone. This suggests that the token still has room to maneuver to the upside before encountering an exhaustion of buying momentum, provided it manages to overcome the $678 resistance.