Solana Base Recovery Chart: Source: WebTrend on X
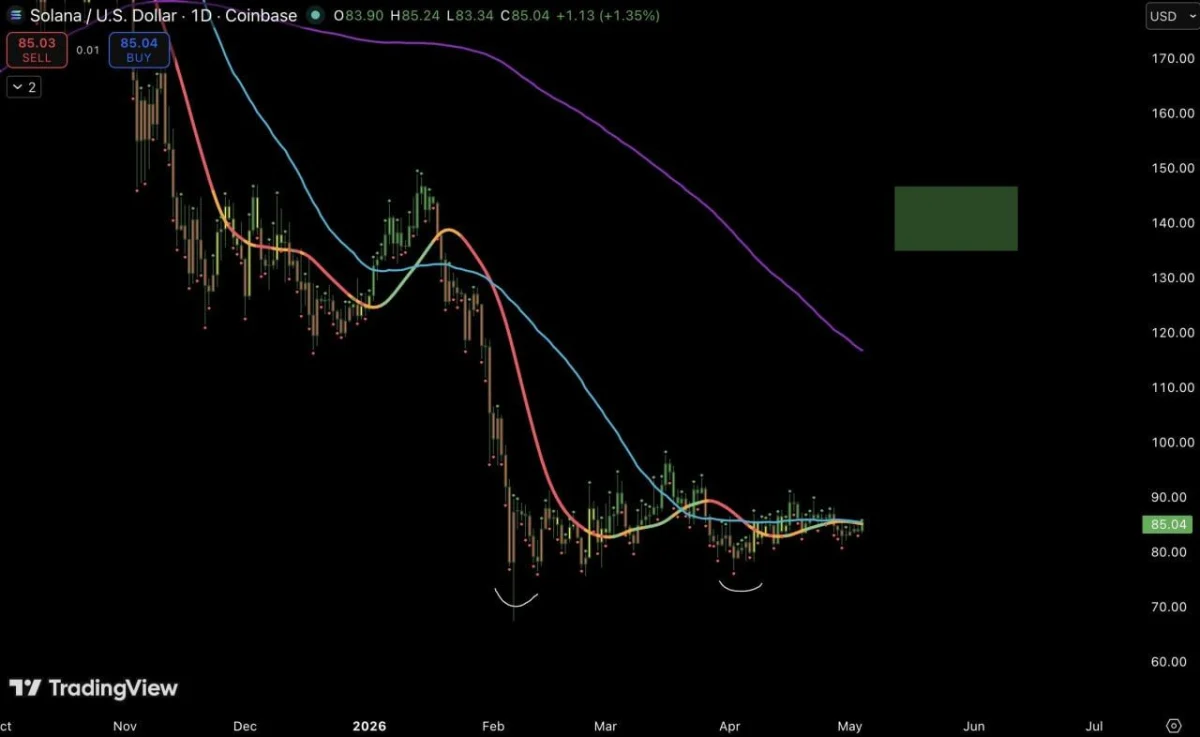
$SOL remains below the larger moving average structure, including the long-term purple line near the $115 to $120 area. That keeps the broader trend under pressure, even though the short-term chart has started to flatten.
The green target box sits around the $135 to $145 zone. For $SOL to move toward that area, price first needs to break above the nearby resistance around $90 to $100, where previous candles rejected in March.
A clean move above that zone would give buyers stronger control and could open the path toward the higher moving average area. However, failure to break above resistance could keep $SOL inside the current range near $80 to $90.
For now, the chart shows Solana trying to build a base after months of selling. The setup stays stronger if $SOL holds above the recent support area and starts closing above the short-term moving averages.
Solana Tightens Inside Triangle as Analyst Eyes Move Above $100
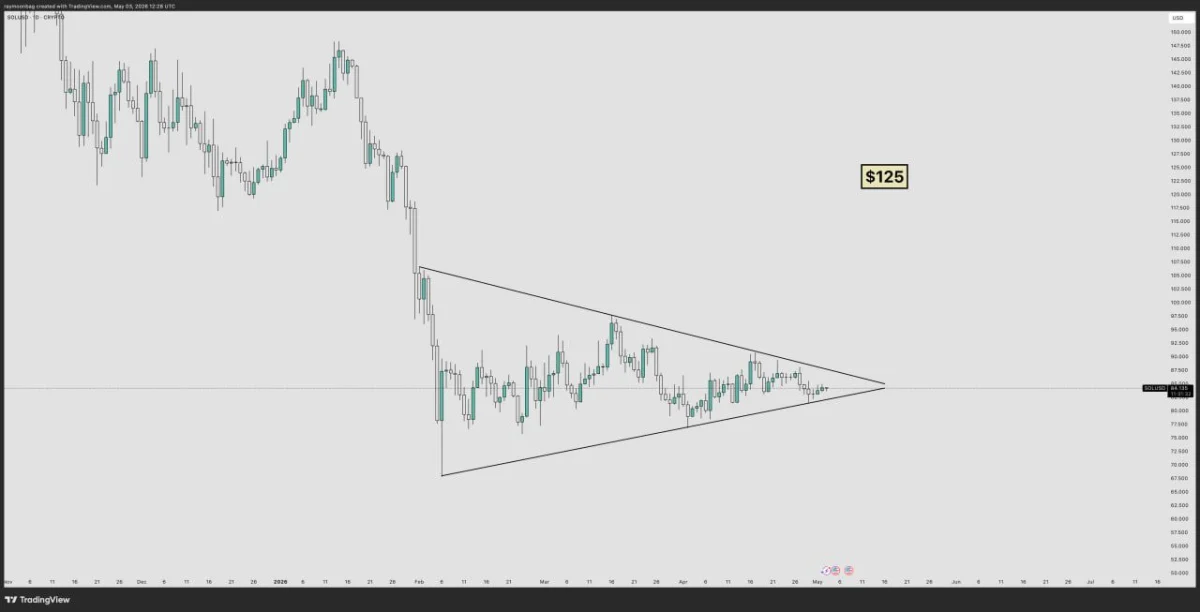
Solana traded near $84.13 on the daily $SOL/USD chart shared by Ray, while price compressed inside a tightening triangle after its sharp February sell-off.
The chart shows $SOL forming lower highs and higher lows between roughly $70 and $97. This structure means price has been moving inside a narrowing range, with buyers defending higher lows while sellers continue to cap each recovery attempt.
Solana Triangle Breakout Chart: Source: Ray on X
Ray said he thinks $SOL will move above $100 very soon. The chart supports that view only if Solana breaks above the upper trendline, which sits near the $85 to $90 area.
A clean breakout above that trendline could open the way toward the March high near $97. After that, $SOL would need to reclaim $100 to confirm stronger upside momentum.
The chart also shows a higher target label at $125. That level sits above the breakout zone and could become a later target if $SOL clears the triangle and holds above $100.
However, the setup weakens if $SOL loses the lower trendline near the $80 to $82 area. In that case, price could revisit the lower range near $70 to $75, where the triangle started after the February drop.
For now, $SOL is near the point where the triangle ends. The next move depends on whether price breaks above the upper trendline or falls back below the rising support line.

 coinpaper.com