$XRP Holds Steady as Broader Structure Builds
$XRP is currently trading around $1.40, posting modest gains of 0.64% on the day, 1.26% over the past week, and about 8.2% over the last month. While short-term movement appears relatively calm, the bigger picture suggests a steadily forming bullish structure.
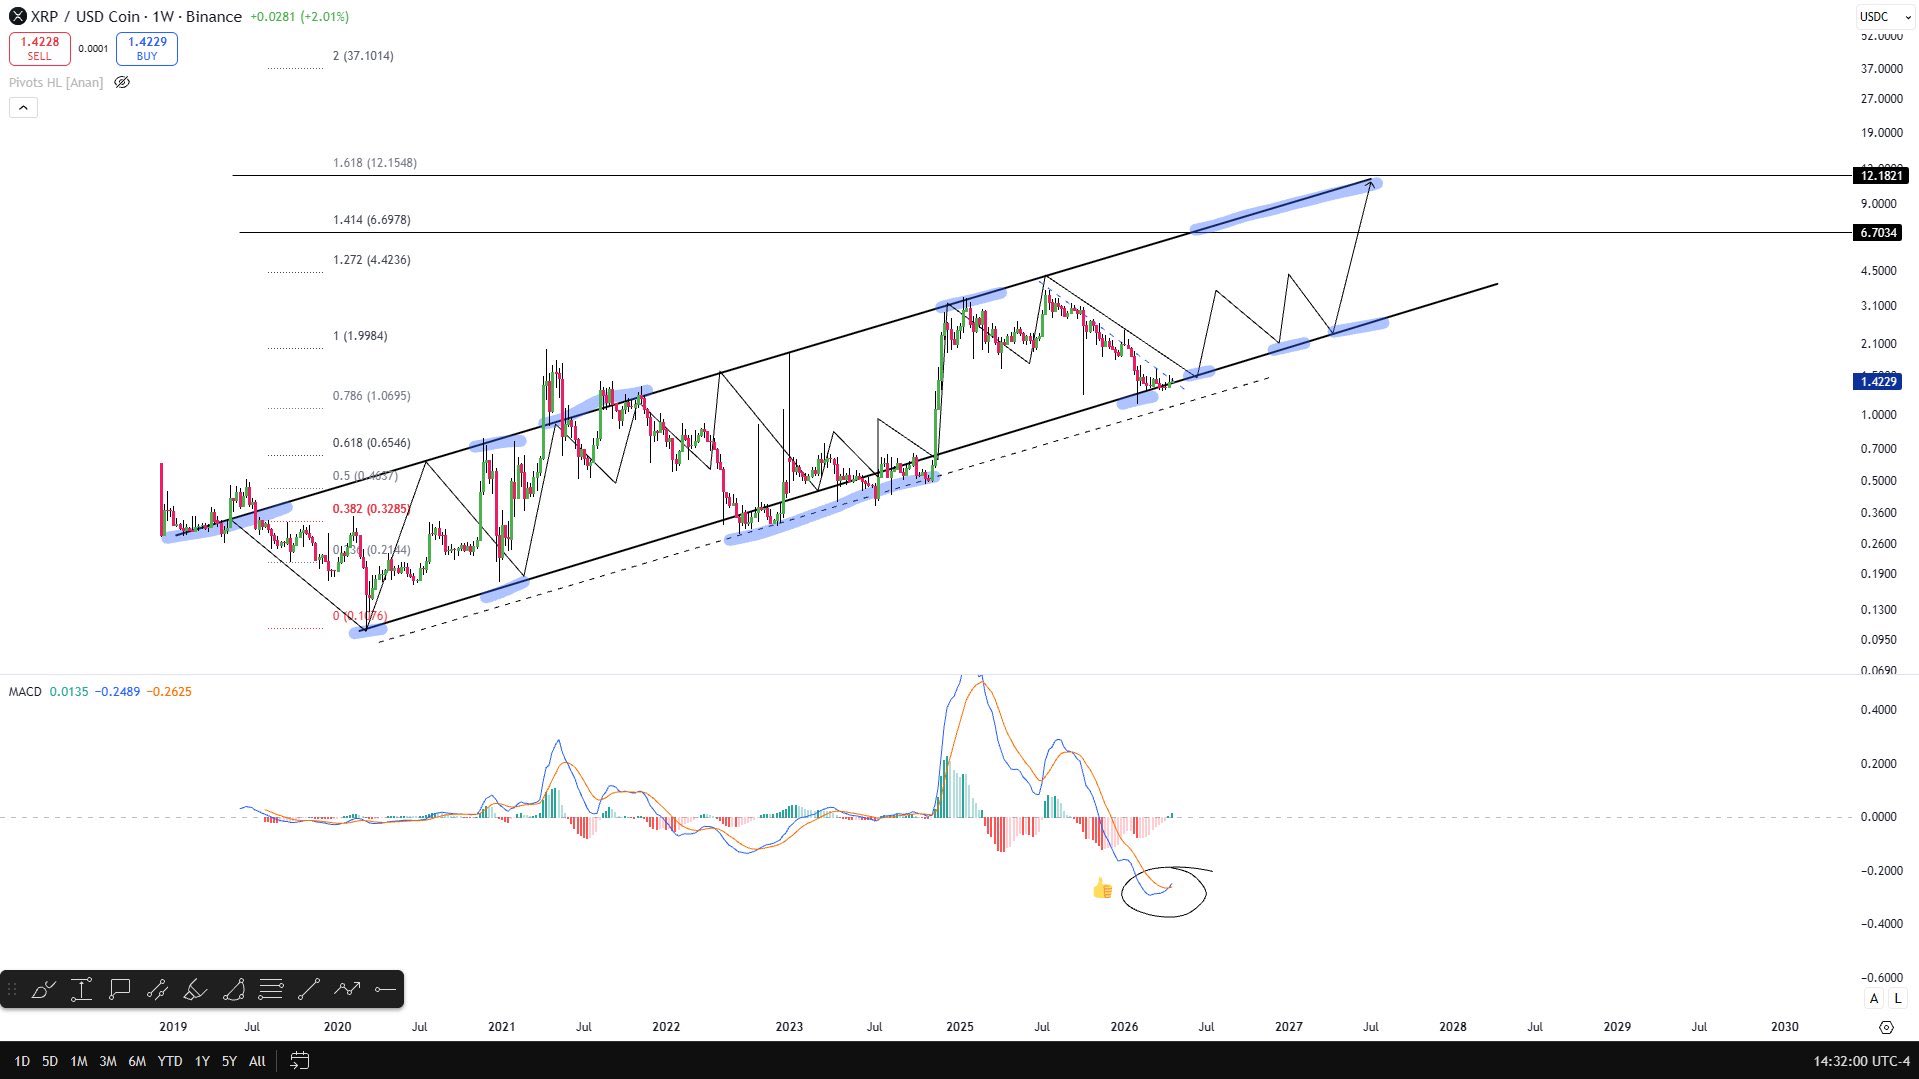
Kucuker’s analysis focuses on a multi-year ascending channel, where $XRP has consistently printed higher lows while respecting a rising trendline. This structure highlights gradual accumulation ahead of a stronger breakout phase.
Technical Setup Points to Higher Targets
According to the chart, $XRP is moving within a well-defined range, with resistance zones aligning near key Fibonacci extension levels. The projected path shows $XRP continuing its upward trajectory, eventually testing:
- Around $6.70 (intermediate resistance)
- Followed by a move toward $12+ at the upper boundary of the channel
The analyst suggests that if momentum builds and macro conditions remain supportive, $XRP could reach this range within the next two years, specifically by April 2027.
What $8 and $12 Mean for $XRP Investors
If $XRP climbs from $1.40 to $8, it will represent a gain of approximately 471%. Meanwhile, a move to $12 would mark an even larger increase of about 757% from current levels.
These projections highlight the scale of the potential upside, though they remain dependent on continued market strength and sustained demand.
Momentum Signals Show Early Shift
Supporting the bullish case, the MACD indicator on the chart shows signs of a potential reversal after a prolonged bearish phase. At the same time, $XRP remains above important support levels, indicating that buyers are still in control despite recent sideways movement.
That said, it still needs to break past nearby resistance to confirm a stronger upward move. Until then, the price may continue moving sideways with a slight upward bias.
Meanwhile, Kucuker’s projection adds to a growing number of long-term bullish forecasts for $XRP.
Imminent Breakout as Volatility Hits Multi-Year Low
For instance, analyst Seth recently revealed that $XRP has formed its tightest Bollinger Bands squeeze in years. This observation implies extremely low volatility and a likely sharp move ahead.
According to the analyst, key levels include resistance at $1.67, $2.00, $2.40, and $2.90, and support at $1.25 and $1.10. While the signal remains neutral, some analysts see accumulation and easing sell pressure as bullish signs.

 thecryptobasic.com