Solana trades at $84.63 on April 29, sitting at the apex of a descending triangle that analyst Ali Charts says is coiling for a 10% move, as the Solana Foundation released a quantum readiness report confirming post-quantum protection is already built and deployable without disrupting network performance.
$SOL Hourly Chart: CRT Range Forms Right At The Triangle Apex
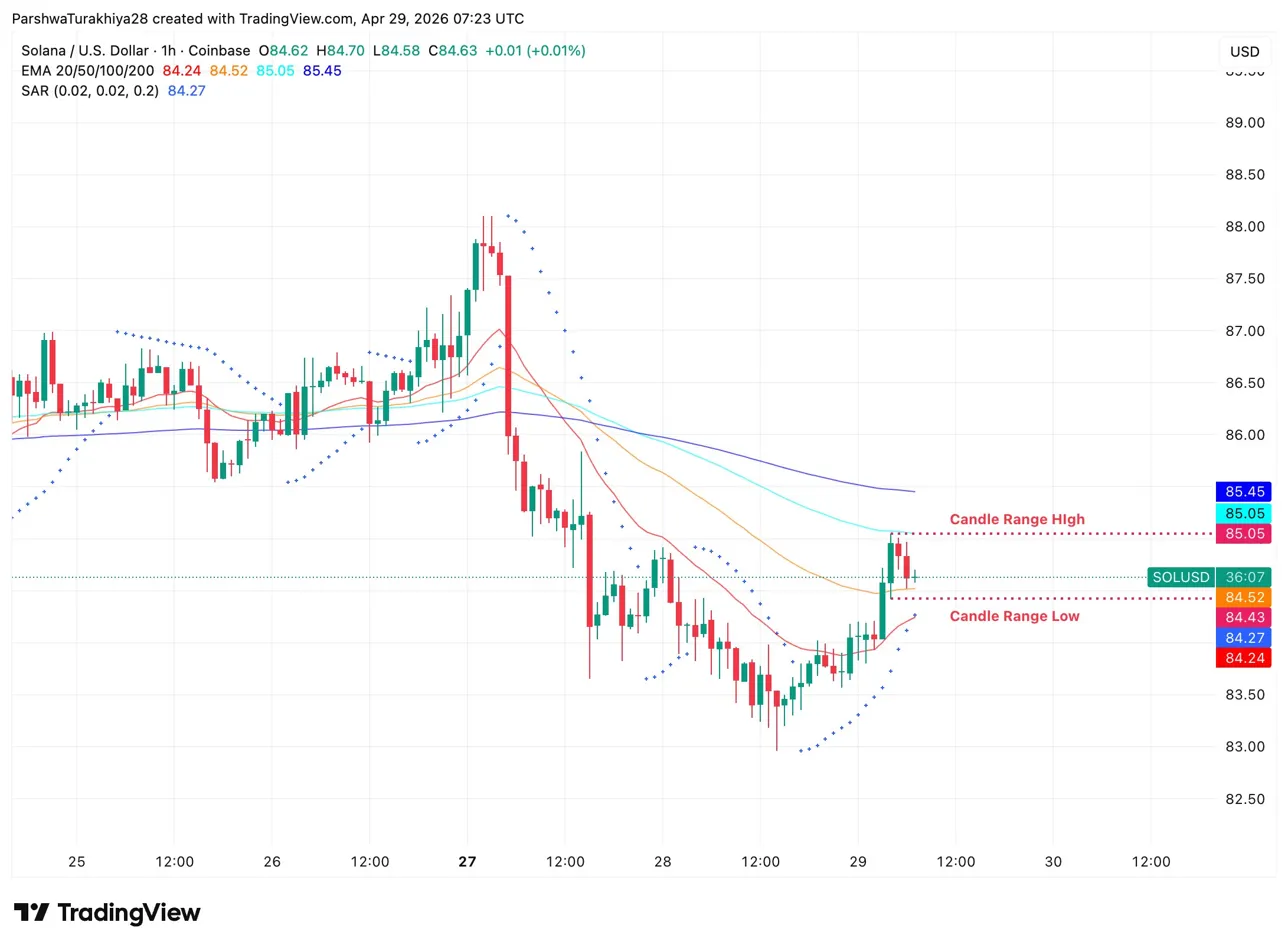
The CRT setup has defined a candle range with the high at $85.05 and the low at $84.43. Price sits at $84.63, inside the range and above the SAR at $84.27. The 20-day EMA at $84.24 sits just below the SAR, creating a support cluster between $84.24 and $84.27.
The CRT range measures 62 cents from $84.43 to $85.05. The three-times measured target projects to approximately $86.91 above the range high, aligning with the upper boundary of Ali Charts’ descending triangle near $87. A clean hourly close above the range high at $85.05 is the trigger.
Related: Cardano Price Prediction: Hoskinson Warns Quantum Threat Coming Fast As ADA Eyes CRT Range Breakout
The EMA stack overhead adds weight to that level. The 50-day at $84.52 sits inside the current range, the 100-day at $85.05 lands exactly at the range high, and the 200-day at $85.45 sits just above it. All four EMAs are compressed into a 1.2-point spread, a configuration that tends to resolve fast once it breaks.
Key levels for April 30:
- SAR and 20-day EMA support: $84.24 to $84.27
- CRT range low: $84.43
- 50-day EMA: $84.52
- Current price: $84.63
- CRT range high / 100-day EMA: $85.05
- 200-day EMA: $85.45
- CRT measured target: $86.91
- Triangle breakout target: $93.00
Ali Charts Flags 10% Move As Triangle Runs Out Of Room
Solana $SOL could be setting up for a 10% move as it approaches the apex of this triangle. pic.twitter.com/uO6HnZJjcp
— Ali Charts (@alicharts) April 27, 2026
Analyst Ali Charts posted this week that $SOL is approaching the apex of a descending triangle on the hourly chart, upper boundary sloping down from $92 and lower boundary rising from the April 18 low near $82. Price has been compressing between those two lines since April 18 with the apex now at current levels near $85.82 in his chart.
Descending triangles at the apex resolve with a sharp move as the boundaries converge. Ali Charts put the projected move at 10%, targeting $93 on the upside and $76 on the downside. The CRT setup pointing toward the upside with the SAR and EMA cluster holding as support gives the bull case more near-term weight.
Solana Foundation Confirms Falcon Is Built And Ready
A new report on Solana’s quantum readiness is here, from @anza_xyz and @jump_firedancer.
— Solana Foundation (@SolanaFndn) April 27, 2026
TLDR: Quantum is still years away, and if and when it materializes, the work to migrate Solana is well-researched, understood, and ready to deploy as described below. pic.twitter.com/eNYgJeV2mx
The Solana Foundation published a quantum readiness report this week from Anza and Firedancer, the two teams maintaining Solana’s core infrastructure. Both teams have implemented a test version of Falcon, the same NIST-selected post-quantum signature scheme Algorand runs in production. Falcon can be activated if quantum threats become more immediate without forcing a network-wide disruption, and the implementation is designed to preserve Solana’s speed and throughput.
The report follows two significant security events in April. Drift suffered a $280M exploit traced to a six-month operation by a North Korea-linked group posing as a quantitative trading firm. The Solana Foundation also launched STRIDE, a security evaluation program run by Asymmetric Research offering active threat monitoring to DeFi protocols with more than $10M in total value locked.
$SOL Derivatives: Longs Dominating Despite Volume Drop
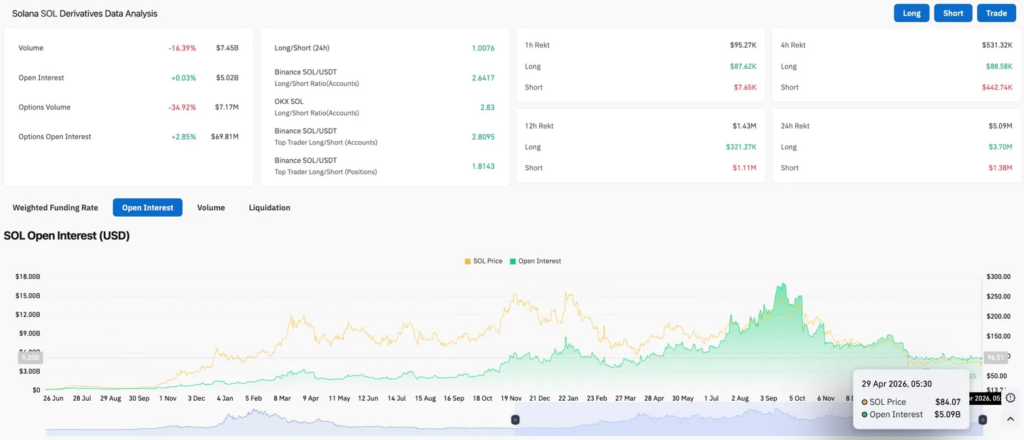
Futures volume dropped 16.39% to $7.45B while OI held flat at $5.02B, up just 0.03%. Volume falling with OI stable means existing positions are holding without fresh aggressive entries. Options OI rose 2.85% to $69.81M while options volume fell 34.92%, existing hedges staying open as new activity dried up.
Related: Humanity Protocol Price Prediction: H Surges 32.52% After Breakout, Eyes $0.20 Resistance Zone
The long/short ratio sits at 1.0076. Binance and OKX top traders both lean long above 2.64. Over 24 hours, longs absorbed $3.70M in liquidations against $1.38M for shorts, buyers taking more pain near the upper end of the CRT range before the breakout confirms. OI at $5.09B sits well below the late 2025 peak near $16B, leaving room to build if the triangle resolves upward.