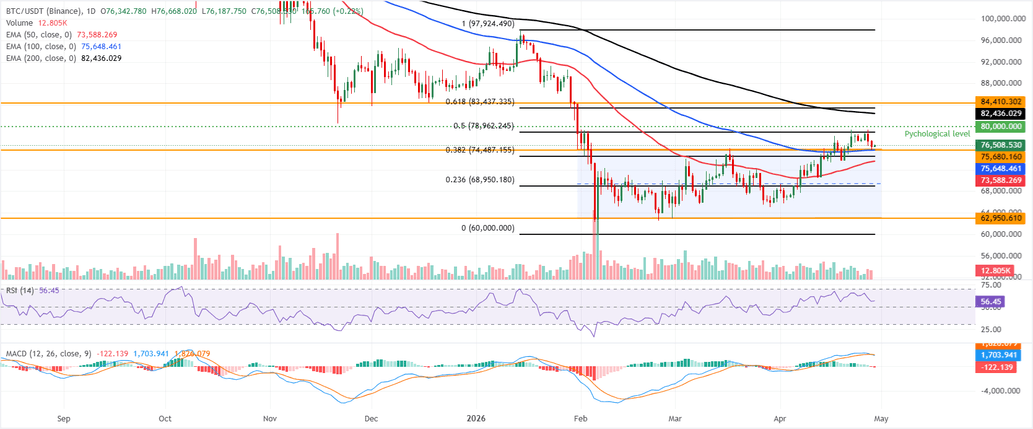
On the downside, immediate support is seen at the former channel top near $75,680, reinforced by the 100-day EMA at $75,648, with the 38.2% Fibonacci retracement (drawn from January high to the February low) at $74,487 and the 50-day EMA near $73,588 providing a deeper cushion before the 23.6% retracement at $68,950 and the channel floor around $62,950.
On the topside, initial resistance emerges at the 50% retracement near $78,962, followed by the psychological $80,000 barrier, while further north, the 200-day EMA around $82,436 aligns with the 61.8% retracement at $83,437 and the horizontal cap near $84,410 to define a major supply zone that bulls would need to clear to extend the broader uptrend.
Ethereum flashes early bearish signals
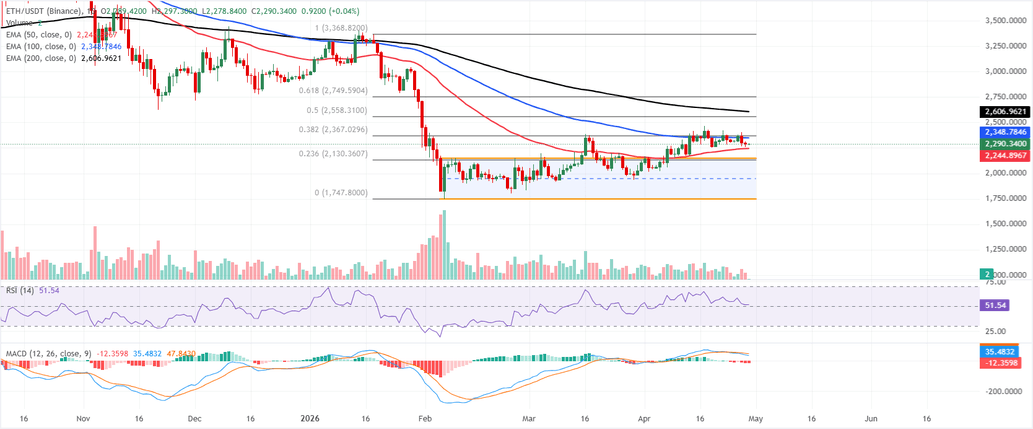
Ethereum is trading at $2,290 on Wednesday, maintaining a neutral-to-slightly bullish tone as it stays above the 50-day EMA at $2,244 while still trading beneath the 100-day EMA at $2,348. This configuration suggests the shorter-term trend supports the recent rebound, but the broader recovery remains capped by medium-term resistance.
The RSI hovers around 52, suggesting balanced momentum, while the MACD remains in negative territory, reinforcing the idea of a tentative advance rather than a decisive breakout.
On the topside, immediate resistance emerges at the 100-day EMA around $2,348, followed by the 38.2% Fibonacci retracement of the latest swing at approximately $2,367; a daily close above this cluster would open the way toward the 50% retracement near $2,558 and the 200-day EMA around $2,606, with the 61.8% level at $2,749 as a more distant barrier.
On the downside, initial support is provided by the 50-day EMA at $2,244, ahead of the upper boundary of the horizontal parallel channel near $2,148, while further weakness could expose the 23.6% Fibonacci level at $2,130, before the channel floor around $1,747.
$XRP slips below key 50-day EMA support
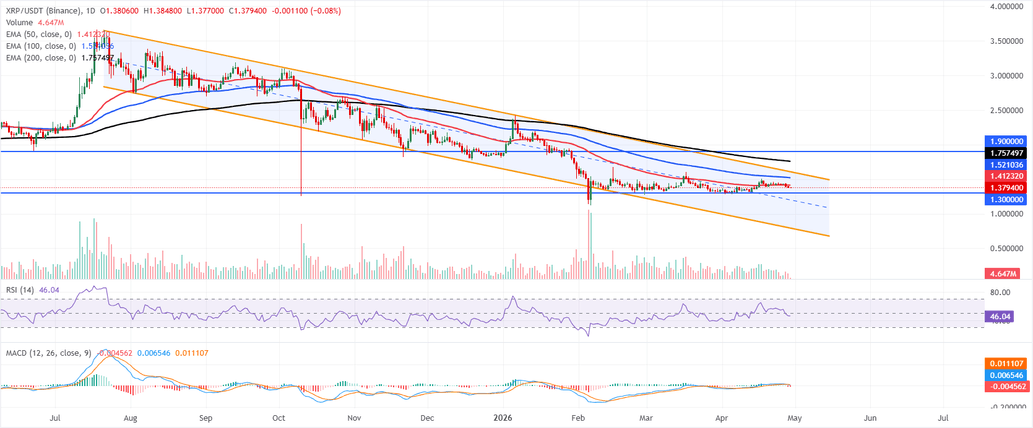
$XRP is trading at $1.37 on Wednesday, keeping a bearish near-term bias as price holds within a broader downward parallel channel and below the main EMAs. The 50-day EMA at $1.41, the 100-day EMA at $1.52, and the 200-day EMA at $1.75 all sit overhead as layered dynamic resistance, suggesting rallies remain corrective within the broader decline.
Momentum backs this capped tone, with the RSI hovering around a neutral 46 and the MACD slipping further into negative territory, suggesting upside attempts could continue to fade against these EMA barriers.
On the downside, initial support emerges at the horizontal level near $1.30, where buyers previously showed interest, ahead of the parallel channel’s lower boundary around $0.79 as a more significant structural floor.
On the topside, immediate resistance is seen at the 50-day EMA around $1.41, followed by the 100-day EMA near $1.52 and the channel’s upper boundary close to $1.60; above that, the 200-day EMA at $1.75 and the horizontal cap at $1.90 form a distant supply zone that would need to be reclaimed to ease the prevailing bearish pressure.
(The technical analysis of this story was written with the help of an AI tool.)

 fxstreet.com