en
Back to the list

XRP Confirms Golden Cross: Analyzing 30% Gap to 200-Day Moving Average

source-logo  u.today 27 April 2026 18:53, UTC
image

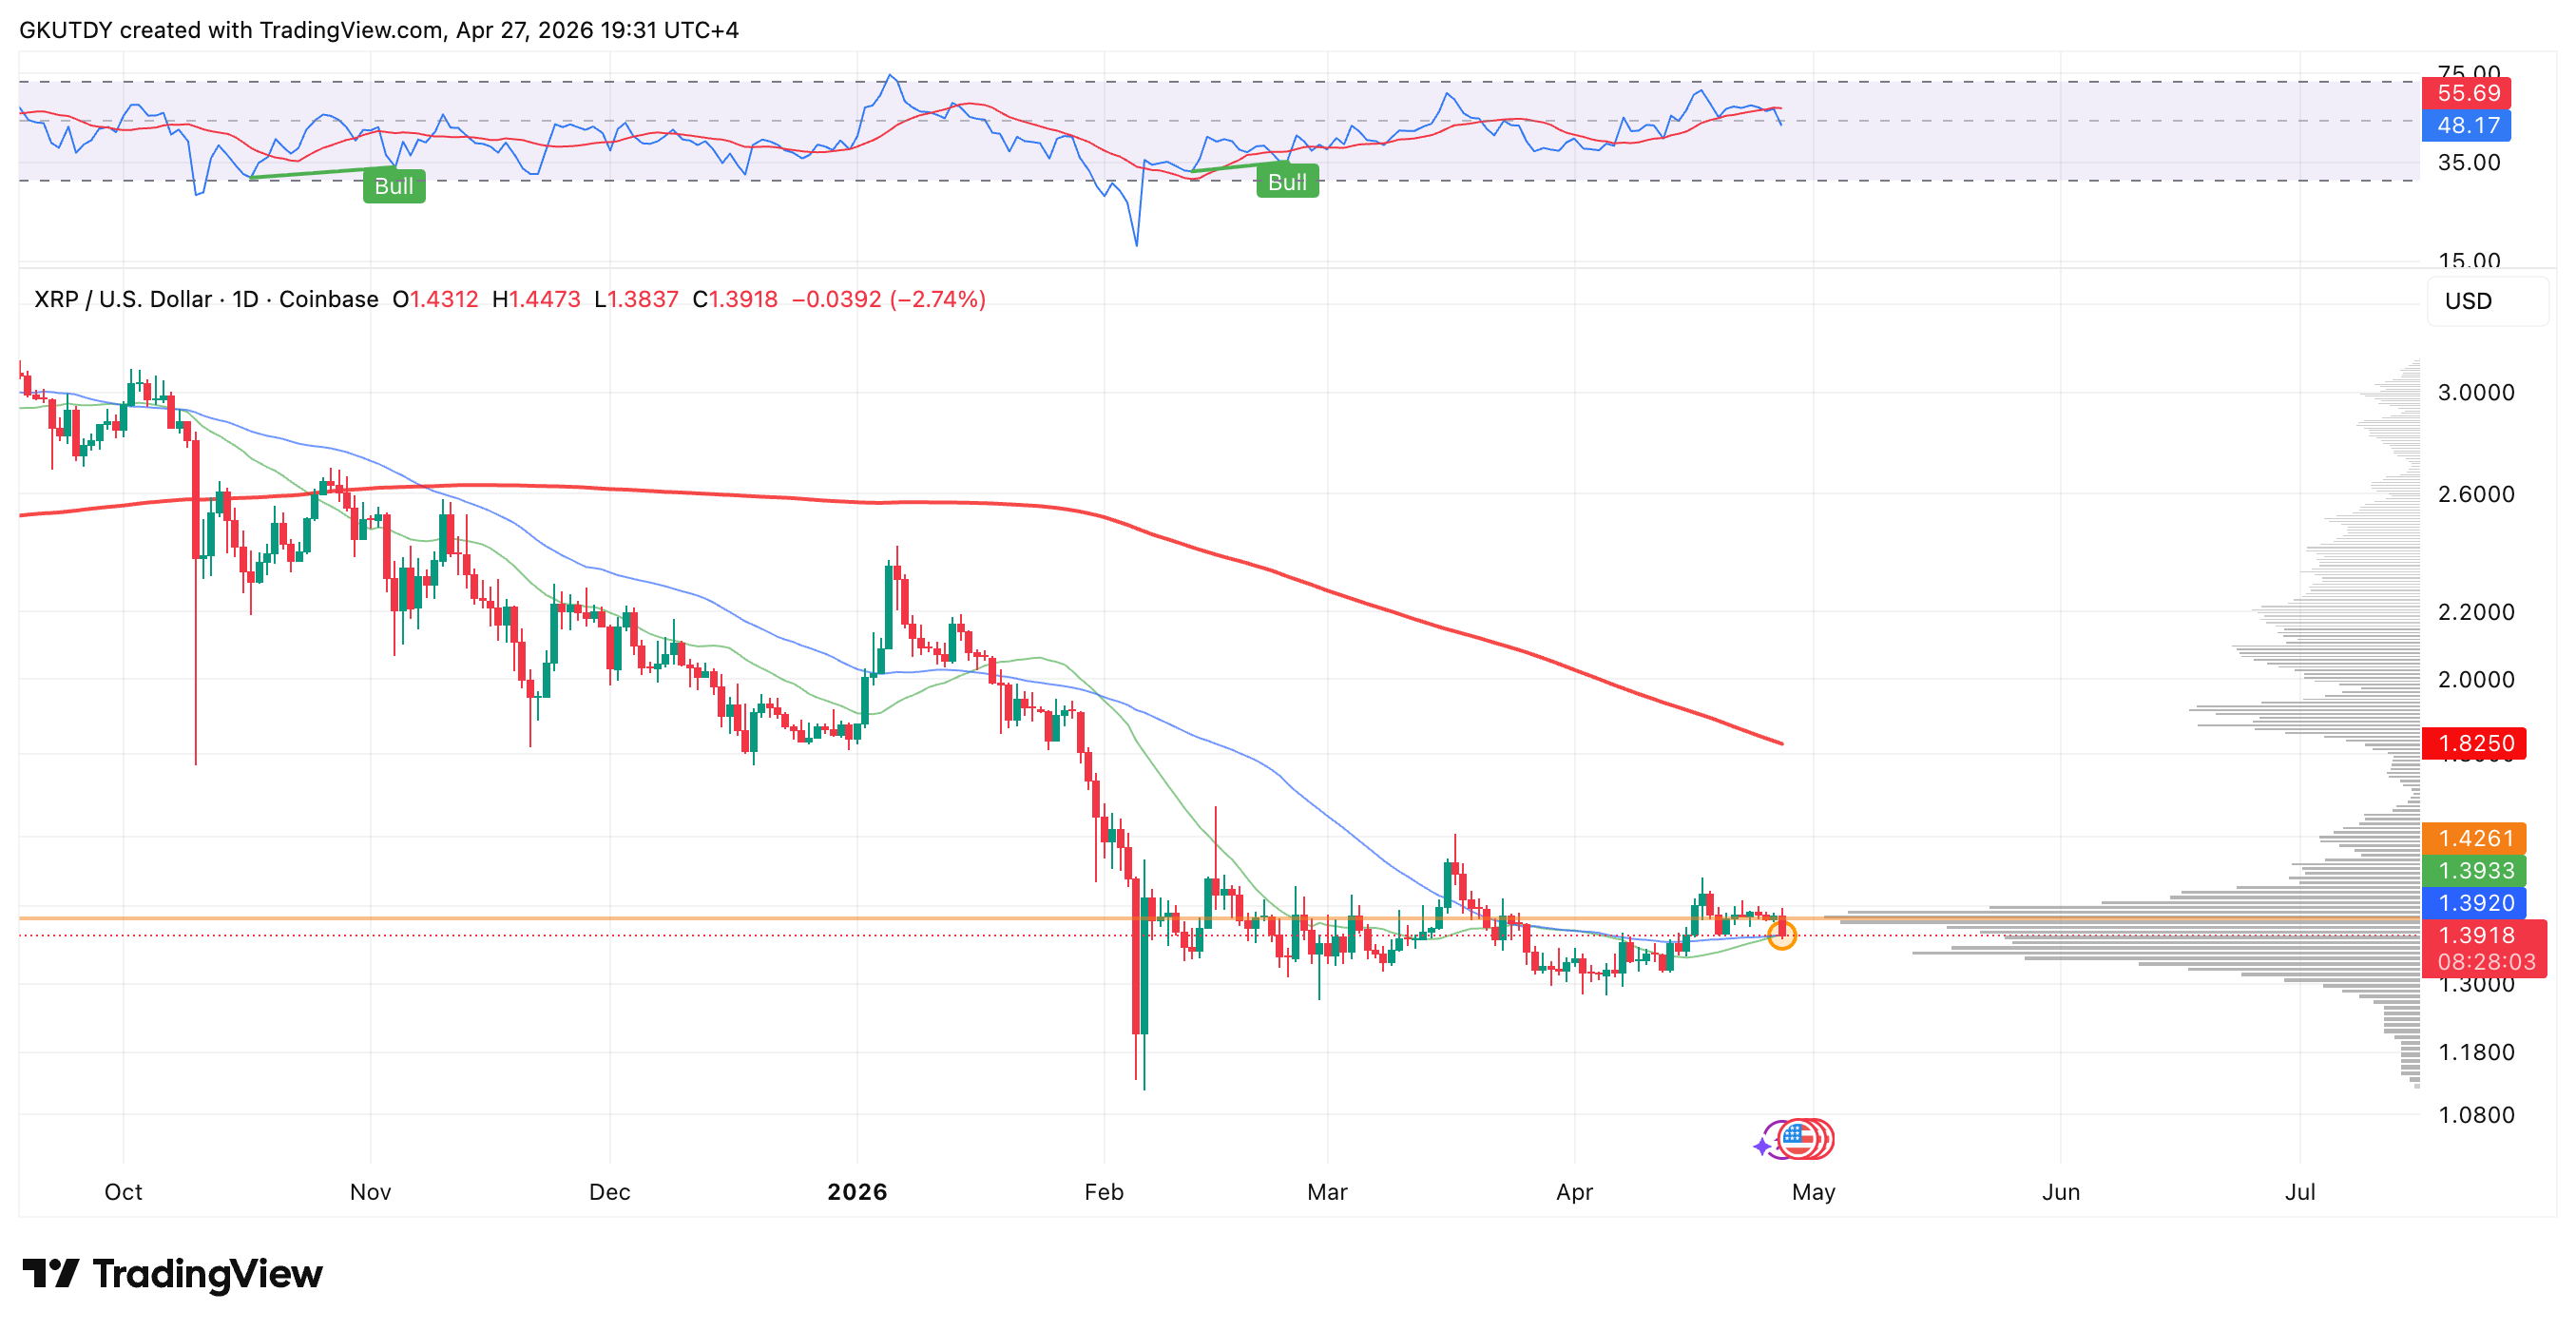
The $XRP market is showing signs of a long-awaited reversal as, after prolonged pressure observed since the beginning of the year, a "golden cross" has formed on the daily timeframe - the short-term 23-day moving average has crossed above the medium-term 50-day moving average from below, as per TradingView.

The main point of interest now is not the fact of the crossover itself, but the distance to the heavy resistance - the long-term 200-day moving average that is currently located at $1.8251.

How the Golden Cross activates a 30% upside scenario

Given the current market price of $1.4037 per $XRP, the technical gap between current levels and the long-term trend stands at exactly 30%. In technical analysis, such gaps often act as a "magnet" after confirmation of a bullish impulse.


More Than Just News
Content, live market tracking, portfolio management, and price alerts — everything you need in the Crypto News app.
Download now, stay on top of the crypto market, and take control of your information.

Among additional factors, the RSI indicator is at 50.15 - a classic neutral zone. This means the market is "unloaded", and buyers have enough room to move upward without the risk of immediate overbuying.

$XRP/USD price chart with moving averages, RSI, and volume profile attached, Source: TradingView

According to volume data, the chart shows that the current consolidation is taking place at levels with high trading activity. This creates a strong foundation: the price has not simply "jumped", but has found support where interest from large players has formed.

Despite the positive signals, $XRP needs to secure above the local high around $1.45 to confirm the seriousness of intentions to challenge the 30% gap. Therefore, for those analyzing the $XRP chart, this is not an explosive pump but a methodical restoration of the trend structure.

If the $1.39 level, where the 50-day moving average is located, holds as new support, the scenario of convergence with the 200-day moving average will become the main vector for the coming weeks.

u.today