
Solana is trading near a key resistance area, while two technical charts show that sellers may still control the next major move. Both setups point to short term bounce attempts, but $SOL must reclaim higher levels to weaken the downside risk.
$SOL Price Faces Wave 2 Bounce Before Possible Drop
$SOL trades near $86.29 on the 1 hour chart, while the analyst marks the move as a possible wave 2 bounce inside wave. That means the current rise may still be corrective, not a confirmed bullish reversal.
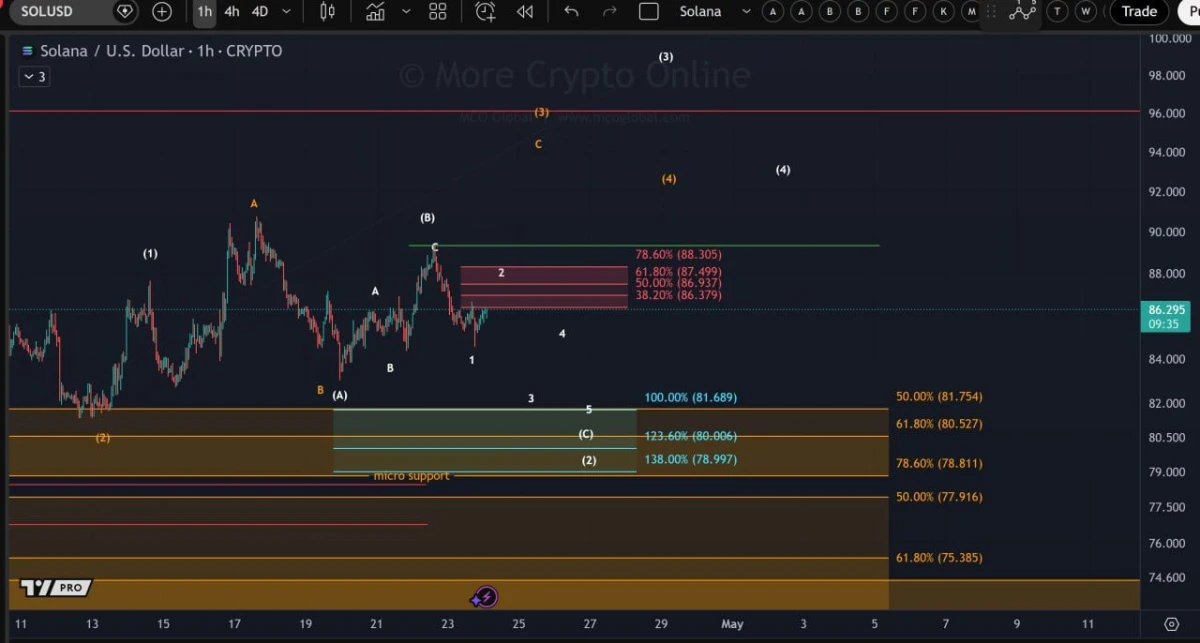
SOLUSD 1H Elliott Wave Setup. Source: More Crypto Online
The key resistance zone sits between $86.37 and $88.30. This area includes the 38.2%, 50%, 61.8%, and 78.6% Fibonacci levels. If $SOL fails there, sellers may regain control and push price lower.
However, a clean move above $88.30 would weaken the bearish setup. In that case, $SOL could test the higher resistance near $89 to $90, where the previous local top formed.
The downside levels remain important. The chart marks $81.69, $80.00, and $78.99 as possible targets if wave (c) continues. The broader support zone also sits near $78.81 to $81.75.
So, the main idea is simple. $SOL can still bounce in the short term, but the chart keeps a bearish structure unless price breaks above the wave 2 resistance area.
$SOL Chart Points to $40 Support Plan
$SOL trades near $85.84 on the daily chart, while the setup shows price struggling below a major resistance zone around $90 to $96.
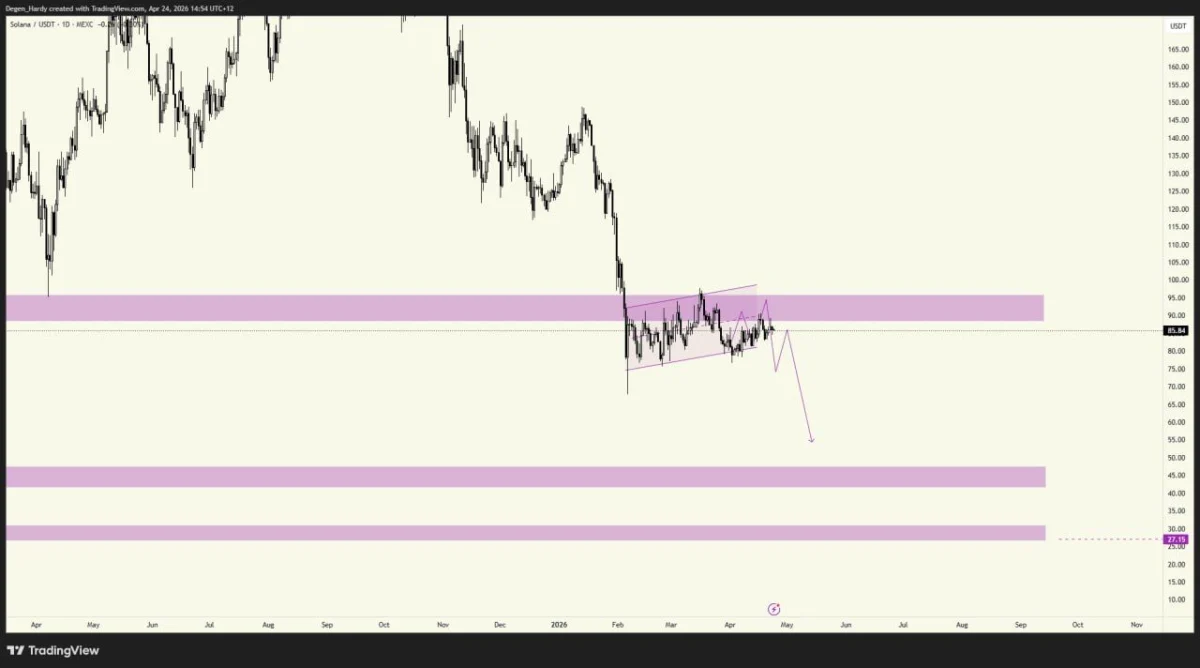
SOLUSDT Daily Support and Breakdown Setup. Source: Degen Hardy
The chart marks a tight consolidation after Solana’s sharp drop from higher levels. Price has moved sideways since February, but it has not reclaimed the purple resistance band with strength.
The drawn path shows a possible fake bounce near the current range before another drop. The main downside target sits near $40 to $47, where the next large support zone appears.
A lower support area also appears near $27.15, though the post focuses on the $40 level as the main buy zone.
Overall, the chart keeps a bearish short term view. $SOL needs a strong daily reclaim above the $90 to $96 zone to weaken this downside plan.