
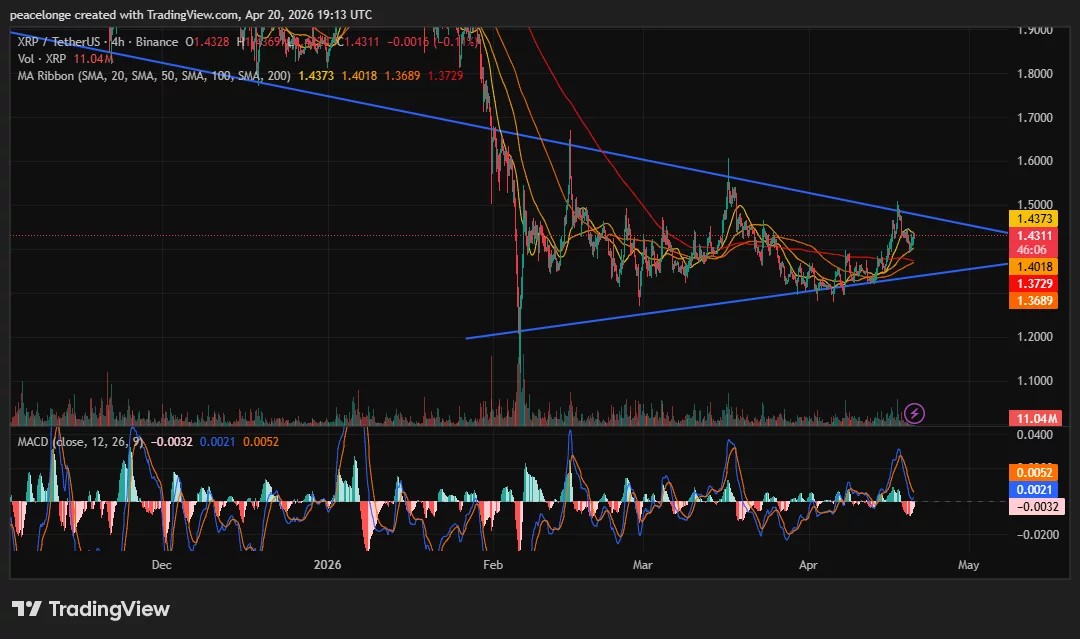
$XRP price is at $1.4311 on April 20, as the 4H chart shows a symmetrical triangle reaching its apex simultaneously with a bearish MACD crossover, compressing an imminent directional resolution into the tightest point of the pattern.
$XRP ($XRP) price is at $1.4311 on April 20, down 0.13% on the 4H session, as a symmetrical triangle on the 4H chart compresses price between a descending upper trendline from the February highs above $1.90 and an ascending lower trendline from the March lows around $1.20. The pattern has reached its apex, and a directional resolution is now imminent. The 4H MACD has simultaneously printed a bearish crossover, with the histogram at -0.0032, adding a momentum signal that aligns with the descending upper trendline acting as resistance overhead. The MA ribbon is partially bullish: SMA 50 at $1.4018, SMA 100 at $1.3689, and SMA 200 at $1.3729 all sit below current price, but the SMA 20 at $1.4373 remains just above price and is acting as the first resistance on a 4H closing basis.
The 4H symmetrical triangle has been forming since the February peak at approximately $1.90, with the upper descending trendline connecting successive lower highs and the lower ascending trendline connecting successive higher lows from the March cycle lows. Volume has been declining throughout the compression phase, which is consistent with the typical symmetrical triangle structure and suggests an expansion of volatility is approaching as the apex closes.
Symmetrical Triangle Apex as 4H MACD Bearish Crossover Prints at Upper Trendline
The 4H symmetrical triangle defines the current $XRP price structure across the period from December 2025 through April 2026, with the converging trendlines now meeting at the current price level. The 4H MACD (12,26,9) has produced a bearish crossover inside the triangle at the apex, with the MACD line at 0.0021 crossing below the signal at 0.0052 and the histogram at -0.0032. Both lines remain above zero, which limits the severity of the bearish signal relative to a subzero crossover, but the directional shift at the triangle apex and SMA 20 resistance overhead is the most relevant nearterm momentum reading.
The SMA 20 at $1.4373 is the key technical level sitting just above price. Until $XRP closes a 4H candle above it alongside the upper triangle trendline, the bearish crossover is the operative 4H signal. A prior analysis published April 15 on crypto.news identified $1.50 as the primary target for an $XRP symmetrical triangle breakout, with the pattern’s measured move from the widest point of the triangle pointing toward that level. Technical convention states that symmetrical triangles resolve with a move equal to the height of the pattern’s widest part from the breakout point, and the widest portion of the current triangle measures approximately $0.25, placing the full measured target near $1.68 on an upside resolution from the $1.43 apex.
Key Levels: Support, Resistance, and Price Targets
The SMA 20 at $1.4373 is the first resistance above current price. A 4H close above it, alongside a close above the upper descending trendline, confirms the symmetrical triangle breakout and opens $1.50 as the immediate target. A sustained move above $1.50 brings the SMA 100 at $1.5625 into view as the next significant resistance in the extended bull case.
On the downside, the lower ascending trendline is currently near $1.37 to $1.38 on the 4H chart. A confirmed 4H close below the lower trendline breaks the symmetrical triangle structure and shifts the bias decisively bearish, exposing $1.30 as the next structural support. The lower trendline aligns with the Fibonacci 1.0 retracement level identified in prior daily chart analysis as the key floor below the current pattern. Below $1.30, $1.20 represents the last major demand zone before uncharted territory in the current correction.
Invalidation of the bull case: a 4H close below $1.37.
On-Chain and Market Data Context
$XRP perpetual futures open interest stands at approximately $2.48 billion per Coinglass, down sharply from the over $9 billion recorded in early October 2025. The substantial deleveraging of speculative positioning over the past six months reduces the risk of a cascade liquidation event on either a breakout or a breakdown from the current triangle apex, creating a cleaner technical setup than the crowded positioning of the prior quarter. The 4H volume of 11.04M $XRP on the current session is in line with recent sessions, confirming neither a strong conviction breakout nor a distribution event at the apex.
$XRP ETF inflows reached $17 million in the week of April 14, the strongest weekly inflow since early February, providing a structural demand tailwind that runs counter to the 4H MACD bearish crossover signal. The divergence between improving institutional demand and deteriorating 4H momentum at the triangle apex is the key tension driving the current directional uncertainty.
If $XRP closes a 4H candle above the SMA 20 at $1.4373 and the upper triangle trendline with expanding volume, $1.50 is the primary nearterm target with $1.5625 as the extended objective. A 4H close below the lower triangle boundary near $1.37 triggers the bearish resolution of the apex with $1.30 as the immediate downside objective.