$XRP is showing signs of entering a new bullish phase, with recent price action and long-term chart structure pointing to the potential for a notable upside move.
The outlook is supported by $XRP reclaiming the $1.40 level, a key psychological and technical threshold that is reinforcing growing optimism that a broader breakout may be underway.
In this line, analysis of the weekly chart by Crypto Catalysts suggests $XRP is breaking out of a long consolidation phase spanning 2022 to 2024.
This was followed by a 2025 rally toward $3 and a subsequent pullback that has stabilized around the $1.30 and $1.40 support zone. The current structure mirrors past cycles where extended sideways movement preceded sharp gains.
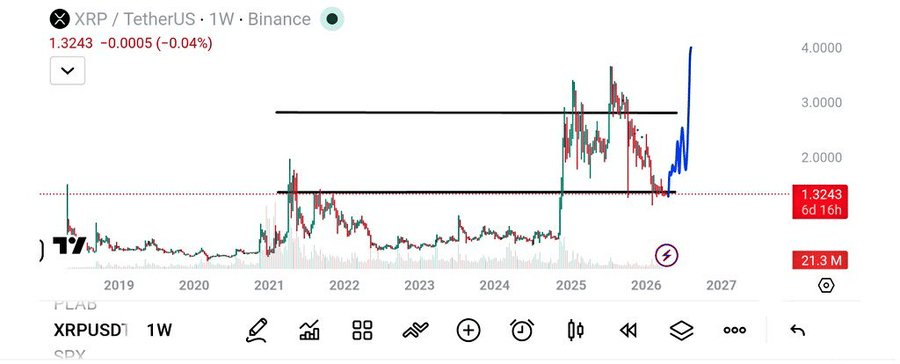
With resistance near $3, holding above current support could drive a retest of that level, while a breakout may open the path higher. The analyst’s pattern comparison points to $5 as the next key target.
More aggressive projections place $XRP as high as $32, implying a roughly 2,100% surge and a move into trillion-dollar valuation territory.
In this case, the speculative rally would push $XRP market cap to almost $1.9 trillion, making the largest cryptocurrency assimung Bitcoin (BTC) record minimal growth over the period.
$XRP SuperTrend indicator
The potential for an $XRP rally has also been highlighted by crypto analyst Ali Martinez. In an April 18 post on X, he pointed to early signs of a trend reversal after the SuperTrend indicator flipped bullish on the daily chart for the first time since January 17.
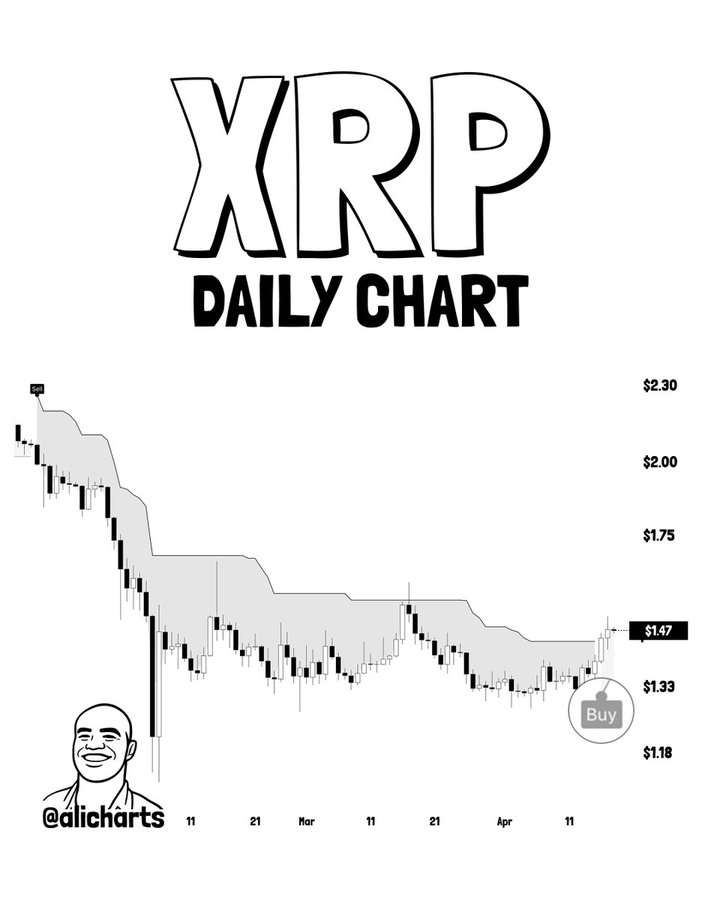
The shift follows months of downside pressure and range-bound trading after a sharp earlier decline.
$XRP has since stabilized around the $1.30 and $1.35 support zone, where buyers have consistently stepped in, with price now climbing toward $1.47 as momentum builds and the SuperTrend acts as trailing support.
However, $1.55 remains a key resistance level, having capped recent upside attempts. A decisive daily close above this level could confirm a breakout and trigger a broader relief rally, with the next upside target near $1.90 based on prior resistance zones.
$XRP price analysis
By press time, $XRP was trading at $1.43, having dropped about 2.3% in the past 24 hours. On the weekly timeframe, however, the asset remains up over 7%.
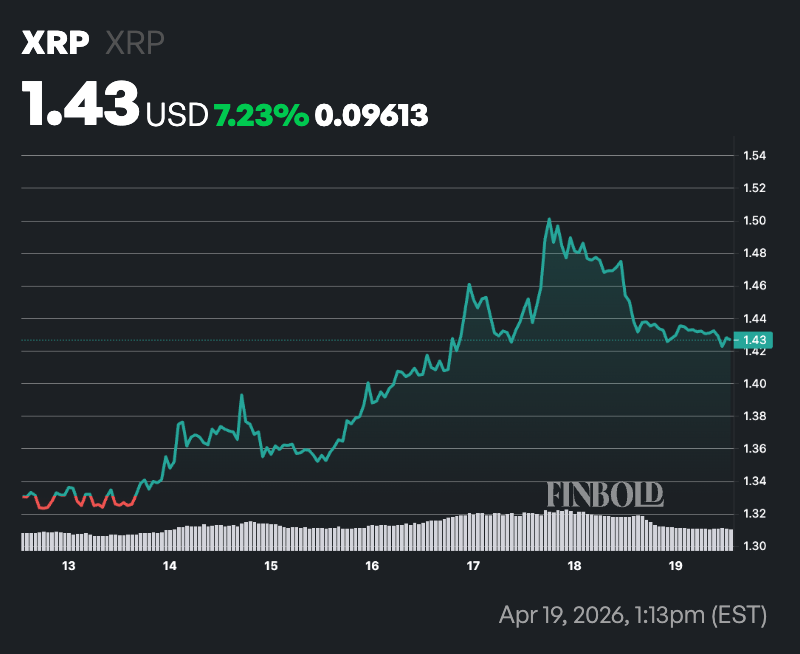
At the current price, $XRP is sitting slightly above its 50-day simple moving average (SMA) of $1.38, suggesting that short-term support is holding and the price retains a modest bullish bias in the near term.
However, the much higher 200-day SMA at $1.90 highlights a broader downtrend, indicating that $XRP remains below a key long-term resistance level and has yet to fully regain macro bullish momentum.
The 14-day RSI at 64.94 is neutral but approaching overbought territory, indicating solid buying pressure with room for further gains, though a short-term pullback is possible if momentum begins to fade.