
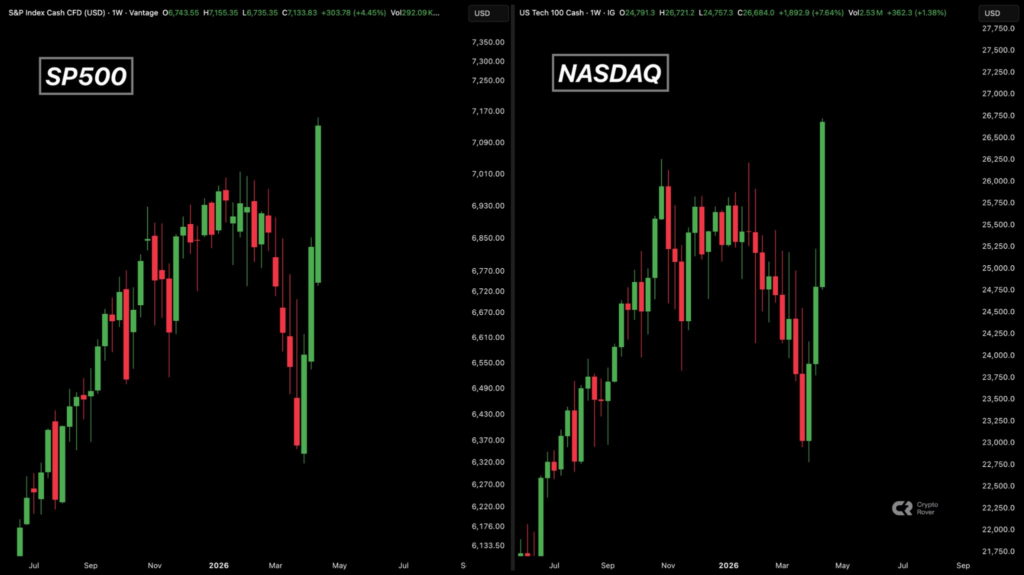
- S&P 500 weekly closes surge above $7,000, the NASDAQ above $24,000, and $BTC surges on institutional inflows.
- Soft US inflation data and strong $SPX $BTC correlation fueled short squeezes and a risk-on equity rally.
- This raises questions about whether it is a bull market or a bull trap, and whether it could extend gains or trigger a pullback.
On April 18, 2026, the S&P 500 and NASDAQ closed at their highest weekly candles ever as the U.S. stock market soared, fueling new all-time highs above $ 7,000 for the S&P and $24,000 for the NASDAQ.
Bitcoin ($BTC) also mirrored the equity market’s strength, with a solid weekly close, trading firmly above the $75,400 to $75,800 range on Friday, supported by positive ETF inflows and short covering as geopolitical fears eased.
$SPX, NASDAQ, and $BTC Post Strong Bullish Weekend Closes
The S&P 500 and NASDAQ both posted their highest weekly green candles on record for the week ending April 17, 2026, closing at fresh all-time highs amid a powerful risk-on rebound. S & P 500 surged 4.5%, up 309.17 points for the week, finishing above $7,126.06, its third straight record close.
Meanwhile, NASDAQ surged 6.8%, gaining 1,565.59 points for the week and closing above $24,468.48. It recorded its 13th consecutive daily gain, the longest winning streak since 1992, and also sealed a record weekly close.
Source: X
Bitcoin ($BTC) mirrored the equity market’s strength with a solid weekly close, extending gains of approximately 6% for the period and trading firmly above the $75,000 level into the weekend, around the $75,400–$75,800 range on Friday. This came alongside positive ETF inflows and short covering as geopolitical fears eased.
Soft Inflation and $BTC Correlation Fuel the Rally
Softer-than-expected core inflation in the March 2026 CPI report released on April 10 triggered the rally. Headline CPI rose 3.3% year-over-year, driven entirely by a 21.2% surge in gasoline prices from the Iran oil shock. Core CPI, however, increased just 0.2% month-over-month and 2.6% year-over-year, both below forecasts. Markets saw the energy spike as temporary, not broad-based pressure.
Meanwhile, $BTC’s tight correlation with equities has amplified the move. $BTC climbed in lockstep from the $68K–$72K range to above $75K by the weekend close, driven by the risk-on sentiment, ETF inflows, and hundreds of millions in short liquidations. Macro tailwinds and equity spillover confirmed a synchronized rally.
What’s Next for $BTC and Equities Amid April 2026 Rally?
Equities could face a momentum-driven grind higher in the coming weeks, with the S&P 500 likely consolidating above the $6,900-7,000 support range before testing fresh records near $7,200. Overbought RSI signals suggest a mild pullback, but easing geopolitical risks and strong earnings keep the path of least resistance bullish. Range-bound volatility could persist through May unless new catalysts emerge.
$BTC rides the risk-on wave, targeting $78K–$82K if it clears $76K–$77K resistance cleanly. ETF inflows and regulatory tailwinds from the CLARITY Act provide support, while April seasonality favors upside. Equities-led consolidation could test $70K support, but the macro setup points to continued catch-up gains.
Therefore, the broader outlook blends bullish liquidity with caution over potential exhaustion. Both assets could continue to benefit in this environment, although profit-taking could trigger a 5 to 8% pullback. Market participants are now watching the S&P 500 near $7,100 and $BTC $80K for confirmation of the next leg higher into summer, balancing opportunity with disciplined risk management.
Related: James Wynn Liquidation Leaves $100M Account Nearly Wiped Out