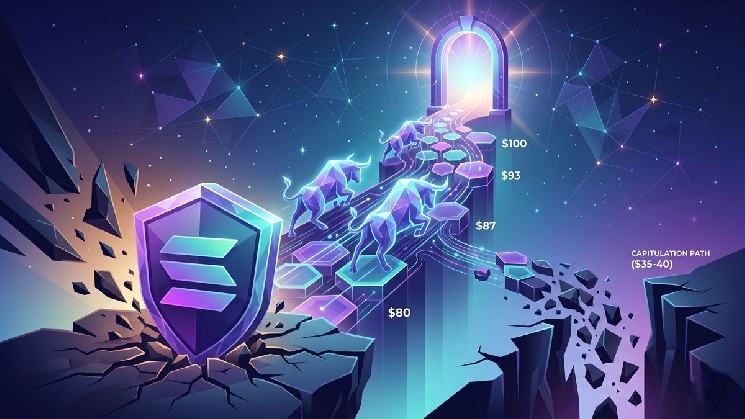
- Solana’s price struggles to hold above the critical $80 support, while facing immediate resistance at $87 and an institutional barrier at $100.
- Analysts point to conflicting targets for 2026: a bullish rally toward $115 if it breaks resistance, or a corrective drop toward the $35 to $40 zone.
- With a capitalization of $51 billion, the asset is trading below its 100-day moving average of $97, keeping the technical structure under bearish pressure.
Solana is facing a prolonged correction from its all-time highs. In recent days, the market has closely watched how Solana defends the $80 support, a level that has served as a base for buyers on multiple recent occasions.
$SOL
— curb (@CryptoCurb) April 16, 2026
compound fulcrum bottom pattern forming on $SOL
1st short term upwards target at ~$115.
send solana higher.#SOLANA ⚡️ pic.twitter.com/W4VNIs0nZk
There have been signs of recovery, but the asset is currently trading near $89.13, with a market capitalization above $51,000M. The price remains below the 100-day simple moving average, located at $97, confirming that bears maintain macroeconomic control.
The technical structure shows a series of lower highs and lower lows, operating 67% below its all-time high of $260. This pattern suggests that, although short-term bounces exist, the primary trend remains bearish as long as the $100 zone is not recovered.
On the other hand, trading volume showed slight increases during consolidations, indicating aggressive accumulation at low levels. However, constant rejections between $90 and $100 significantly limit any attempt at an organic rise.
If selling pressure increases and support breaks, the price could seek liquidity at lower levels. Some analysts suggest that a break of $78 would open the door toward $50, or even toward a deeper floor near $35.

Reversal signals and price consolidation
Not all indicators are pessimistic, as some analysts identify the formation of a “composite fulcrum” bottom. This compression pattern usually precedes a trend reversal if the price manages to break the neckline resistance.
Since February 2026, Solana has recorded higher lows, suggesting a gradual strengthening of demand. To validate this bullish scenario, it is imperative for the price to close decisively above the $95-$100 range on the daily chart.
A successful break of the current resistance at $87 could accelerate gains toward $93 in the short term. If the bullish momentum persists, the next technical target is at $115, which would represent a major structural change.
Currently, the asset is in a narrow consolidation range, trapped between the demand zone at $82 and the supply at $87. This volatility contraction is often the prelude to an explosive move in either direction.
The sustainability of the rally will depend on the buyers’ ability to absorb sell orders at the 100-day moving average. Until this level is surpassed, any rise will be considered a temporary relief within a bearish structure.
The Solana ecosystem is at a turning point where the defense of $80 is vital to avoid a major capitulation. The market awaits a confirmed breakout above $100 to reactivate bullish sentiment toward the $115 goal.