$SOL/USD 1H. Source: TradingView,MCO Global on X
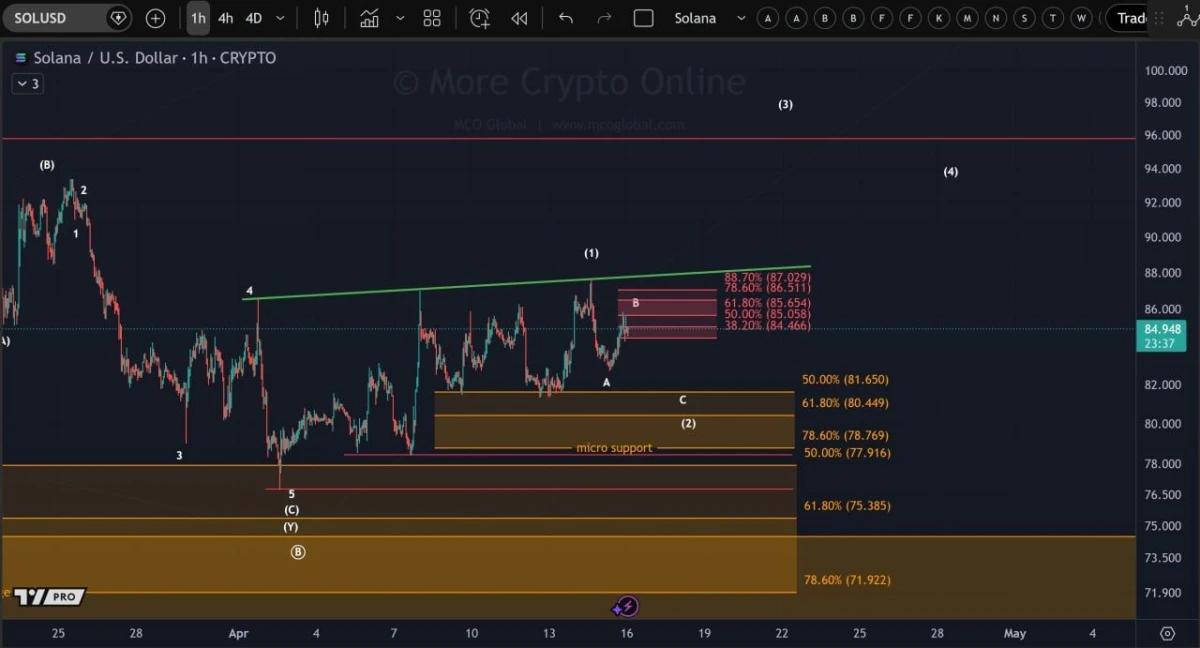
The chart also shows several Fibonacci levels stacked inside this resistance area, with levels near $84.46, $85.06, $85.56, $86.51, and $87.03. Because these levels sit close together, they form a dense supply zone rather than a single breakout line. That usually makes the move harder to clear in one attempt, especially when price approaches it after a short rebound instead of a strong trend leg.
Below the market, the key support zone remains around $81.65 down to the high $77 area, with micro support marked just above $78. If Solana fails at this first resistance band, price could rotate back into that lower demand area. However, if buyers break through the red zone and hold above it, the chart opens room toward the green trendline near the upper $87 to $88 area.
Solana Megaphone Setup Points to Much Higher Cycle Target
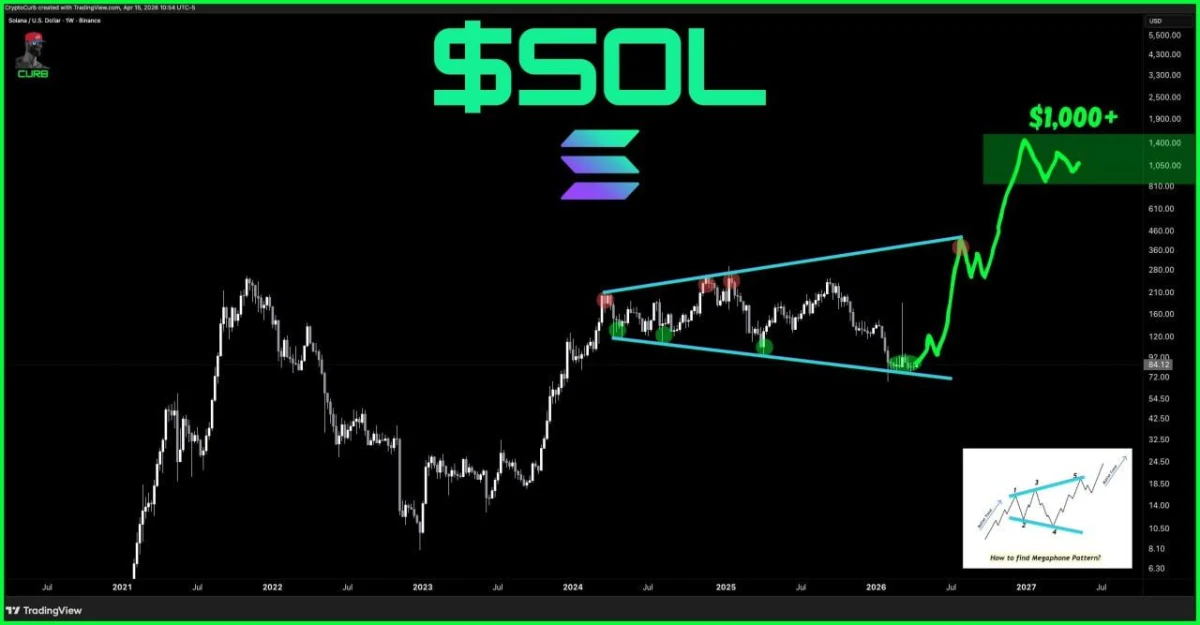
This weekly chart presents a bullish megaphone structure for Solana and argues that the broader cycle may not be finished yet. The setup marks repeated touches at both the upper resistance line and the lower support line before showing a projected breakout path to the upside. In this view, the pattern suggests expansion after a long consolidation phase rather than trend exhaustion.
Solana / U.S. Dollar 1W. Source: TradingView,CryptoCurb on X
The chart highlights several reaction points inside the widening formation, which is often called a broadening or megaphone pattern. Price moved between rising resistance and falling support across multiple swings, then returned to the lower boundary again. That lower zone now acts as the key base in the structure. If that area keeps holding, the pattern remains intact and supports the bullish thesis.
After that, the projected path shows a breakout above the upper boundary of the formation and then a fast markup phase. The target zone on the chart sits above $1,000, which reflects the analyst’s cycle view rather than a confirmed move. So far, this remains a forward scenario, not a completed breakout. Still, the chart’s core message is clear: if Solana confirms a break from this megaphone structure, the next leg could be much larger than the prior swings inside the range.

 coinpaper.com