
Ripple ($XRP) maintains a neutral-to-bullish tone, trading above $1.41 at the time of writing on Thursday, supported by renewed institutional and retail interest. A steady price increase could accelerate the remittance token toward the next resistance levels at $1.50 and $1.55.
Still, traders should temper their expectations, given that the immediate supply around $1.41 could absorb the gains.
$XRP growing institutional and retail interest boosts recovery outlook
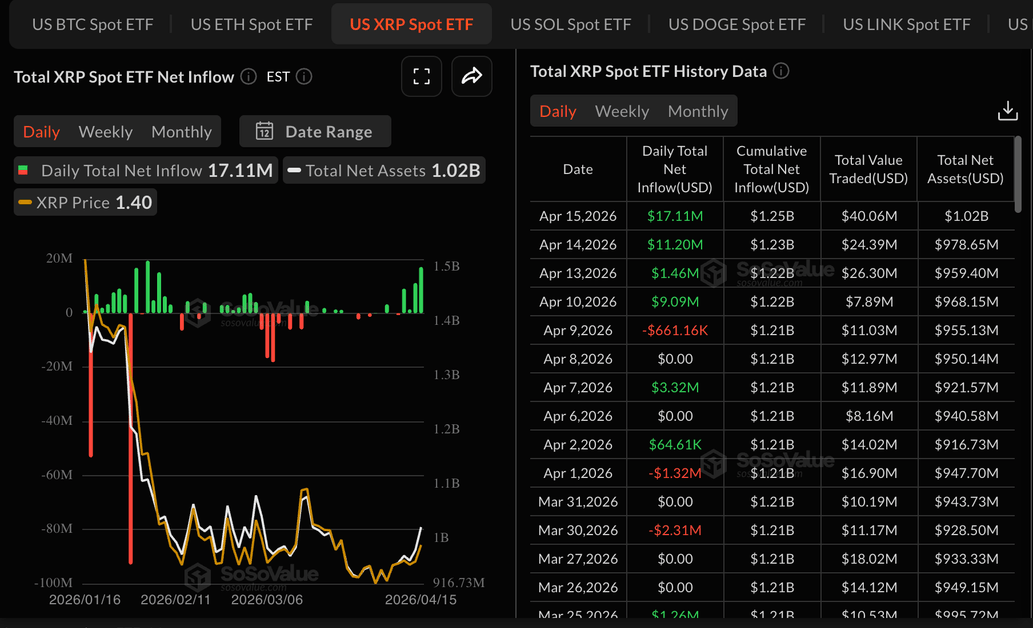
Institutional investors are showing renewed interest in digital investment products, evidenced by US-listed $XRP spot Exchange-Traded Funds (ETFs) recording approximately $17 million in inflows on Wednesday, up from roughly $11 million the previous day.
Cumulative inflows currently stand at $1.25 billion, with net assets under management averaging $1.02 billion, according to SoSoValue data. If inflows into the spot ETFs continue , prices could steadily increase, with $XRP grinding toward the $1.50 psychological level.
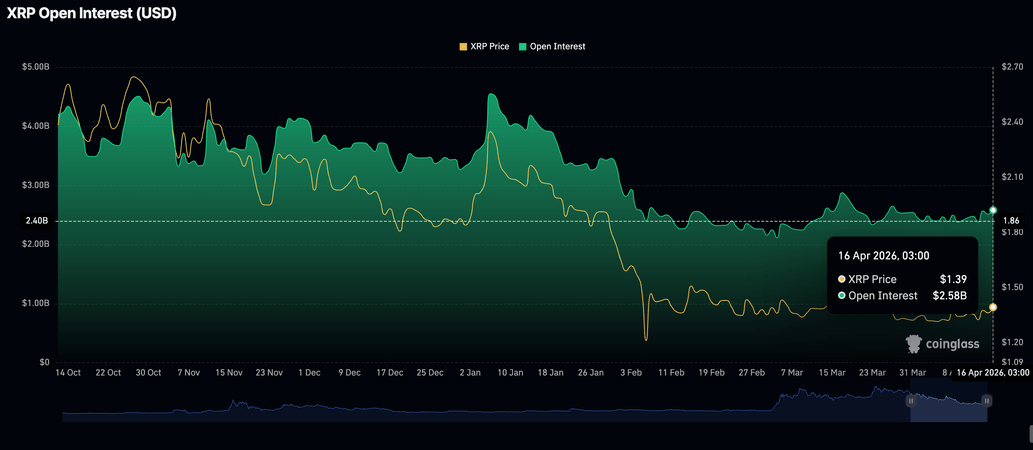
Similarly, retail demand has expanded this week, steadying the $XRP derivatives market. The Open Interest (OI), reflecting the notional value of outstanding futures and options contracts, rose to $2.58 billion on Thursday from $2.51 billion the previous day. The return of retail investors, albeit gradual, suggests growing conviction in $XRP’s ability to sustain upward price action in the short- to medium-term.
Technical outlook: $XRP bulls tighten grip as gains extend
$XRP trades at $1.41 and holds marginally above the 50-day Exponential Moving Average (EMA) and the 50.0% Fibonacci retracement at $1.3946, drawn between the February 6 low of $1.12 and February 15 high of $1.67. Still, $XRP remains well below the 100-day EMA at $1.55 and the 200-day EMA at $1.80, keeping the broader bias capped to the downside.
The Relative Strength Index is near 58 on the daily chart, and a positive Moving Average Convergence Divergence (MACD) histogram hints at improving bullish momentum. Still, this recovery unfolds beneath a dense band of medium-term resistance defined by the higher EMAs and Fibonacci levels.
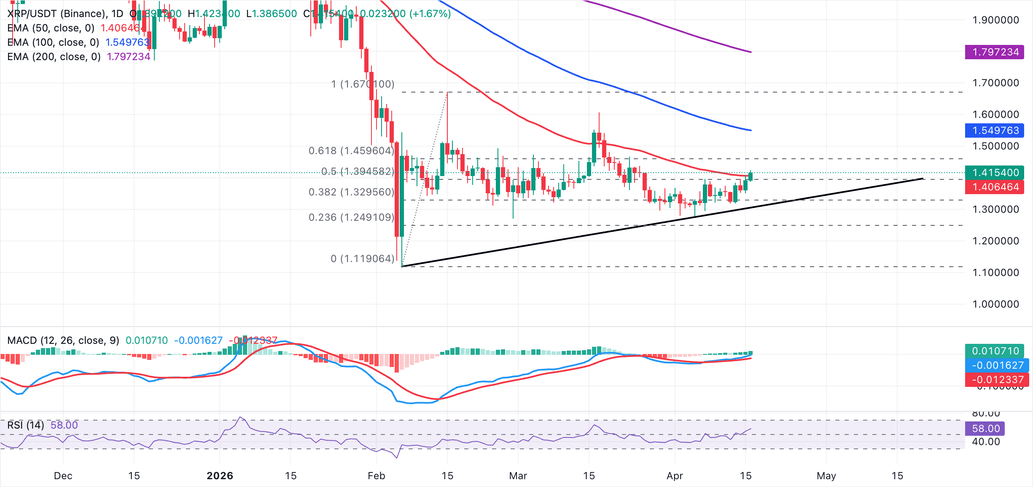
On the downside, initial support is seen at the 50-day EMA around $1.41, followed by the 50.0% Fibonacci retracement near $1.39. A break below this band would expose the 38.2% Fibonacci retracement at $1.33 and the prior trendline break area around $1.31, with the 23.6% Fibonacci retracement at $1.25 acting as a deeper structural floor.
On the topside, immediate resistance emerges at the 61.8% Fibonacci retracement around $1.46, ahead of a stronger cluster at $1.55, where both the 100-day EMA and the 78.6% Fibonacci retracement align.
(The technical analysis of this story was written with the help of an AI tool.)