
Shiba Inu remains stuck within a range on higher timeframes, but has made a golden crossover on the shorter timeframes. What could happen next?
Shiba Inu ($SHIB) trades at $0.000005826, down slightly over the past 24 hours. Its price continues to consolidate while larger-cap coins recover considerably, a trend that saw it lose its place as the second-largest meme coin by market cap to MemeCore (M).
Market users are exercising caution amid the price weakness, as evidenced by a 16% decline in trading volume over the past 24 hours. Shiba Inu’s open interest also took a hit, dropping 8% in the same timeframe to 9.37 trillion $SHIB ($56.24 million). This suggests that both spot and derivative participants are looking elsewhere.
Shiba Inu Golden Cross
However, Shiba Inu recently printed a golden cross on the 30-minute timeframe, an optimistic sign despite the negative trend. For the uninitiated, this cross happens when the 50-period moving average pushes above the 200-period moving average, signaling that buying momentum is increasing.
The golden crossover occurred on Tuesday, signaling a shift in momentum. At the crossing, $SHIB printed its largest green candle of the day on the 30-minute timeframe, rising 1.35%.
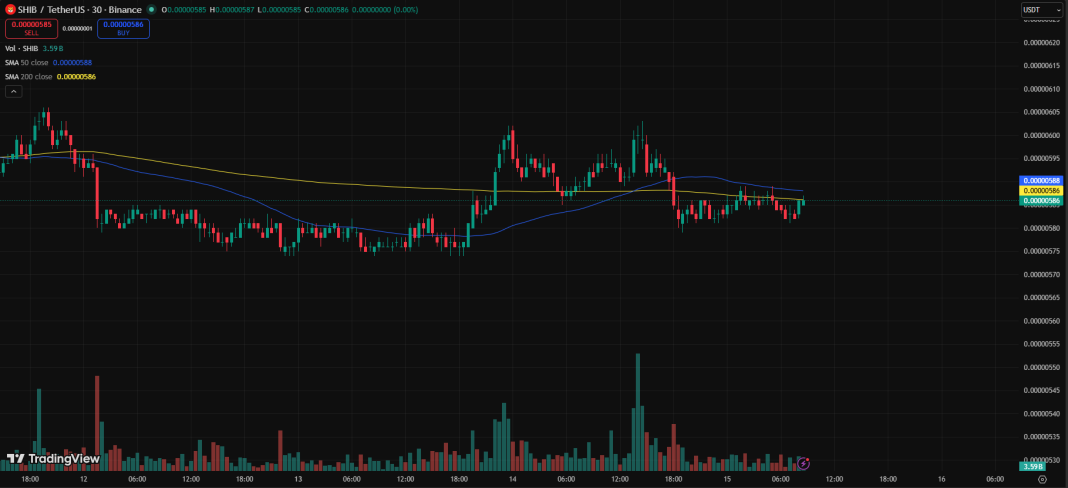
Currently, this crossover still holds, even though $SHIB has consolidated lower from the intraday high of $0.00000603. This trend could see the meme coin rebound considerably when momentum returns and if the broader market conditions remain favorable.
However, it is worth noting that some analysts view a golden cross as a passive indicator that reflects what has already happened in the market. The crossover on lower timeframes is also tricky, as a death cross can also easily form. As such, higher-timeframe confirmation remains crucial.
$SHIB Outlook as Price Remains Range-Bound
Meanwhile, Shiba Inu is in a range on higher timeframes. On the daily chart, the token has trended within a channel for 35 days, dating back to March 11. Within this wedge, it has shuffled between the upper resistance and lower support trendlines.
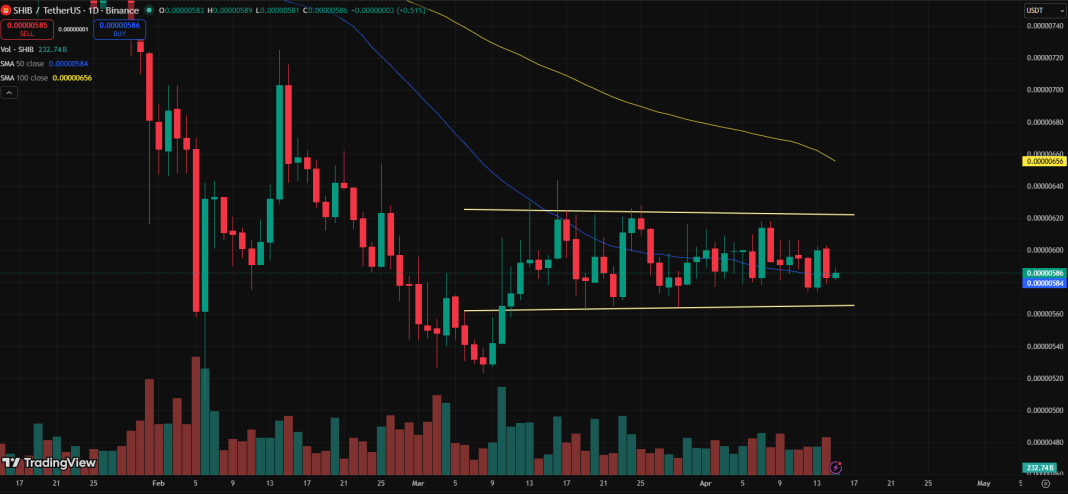
Currently, $SHIB is approaching the channel’s lower support after a 2.83% drop on Tuesday. If bears continue to dominate proceedings, the price may fall to retest the support around $0.00000562. Losing this level could cause the meme coin to break down, targeting $0.00000523 first, then $0.0000050.
However, regaining momentum around the current level or the support paves the way for a retest of the channel’s upper resistance at $0.00000625. A breakout, if momentum persists, targets $0.00000644 first. The next major resistance is around the February 14 lower high of $0.00000725.
Notably, to sustain an uptrend, $SHIB needs to reclaim key moving averages. At its current price of $0.00000585, it trades slightly above the 50-day MA at $0.00000584. The next key level is the 100-day MA at $0.00000656.