crypto.news

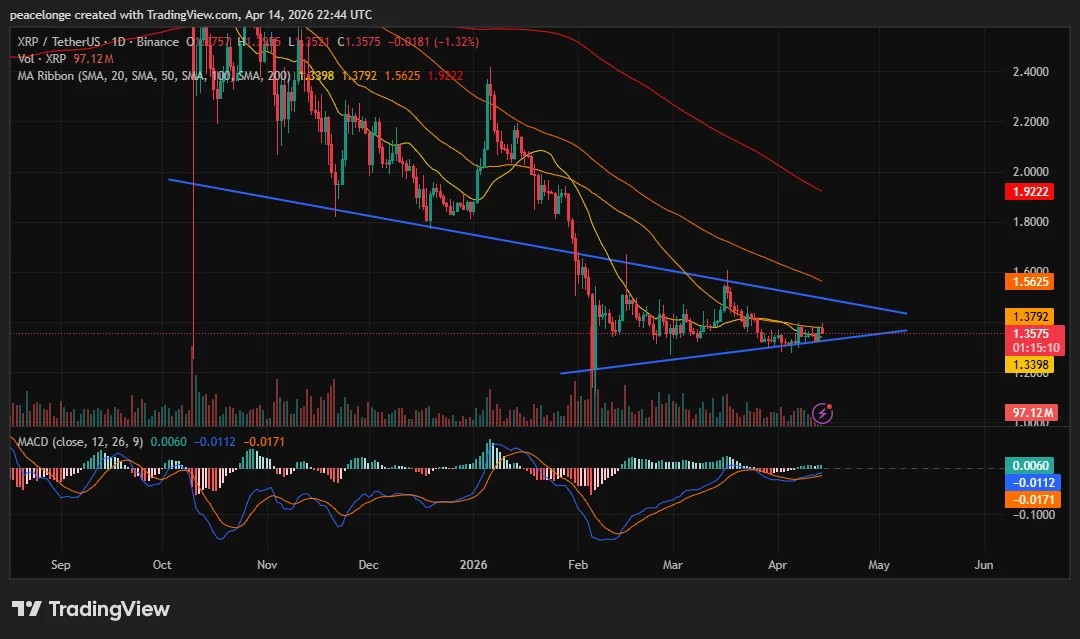
$XRP price is at $1.3575 on April 14, down 1.32% on the session, as a symmetrical triangle converges toward its apex on the daily chart. A daily MACD bullish crossover has printed simultaneously, with the histogram turning positive for the first time in weeks, adding momentum confirmation to a pattern that has been compressing price since early March.
$XRP ($XRP) price is at $1.3575 on April 14, with 24-hour trading volume of $2.24 billion, as the daily chart shows a symmetrical triangle pattern compressing price action between two converging trendlines since early March. The upper descending trendline connects the February highs above $1.60, and the lower ascending trendline runs from the March lows around $1.20. The full MA ribbon sits above price: SMA 20 at $1.3398, SMA 50 at $1.3792, SMA 100 at $1.5625, and SMA 200 at $1.9222, forming overhead resistance at each level. Price is at the apex of the triangle, forcing an imminent directional resolution.
Symmetrical Triangle at the Apex as MACD Prints a Daily Bullish Crossover
The symmetrical triangle on the daily chart reflects the market’s indecision since March, with sellers unable to push $XRP below the ascending lower trendline and buyers unable to break through the descending upper trendline. Each successive high has been lower and each successive low has been higher, compressing the range toward a convergence point that is now directly at price. Apex-level compression in symmetrical triangles typically precedes a strong directional move, and the volume context during the pattern matters: declining volume inside the triangle has been followed by an expansion of volume on the breakout in prior $XRP patterns.