
Ripple ($XRP) hovers around $1.37 at the time of writing on Tuesday, with its upside largely capped below the $1.40 supply threshold. Prior to the stagnation, the remittance token maintained momentum from the weekly open at $1.32, underscoring an improving outlook and building on both institutional and retail demand.
$XRP ETFs, derivatives gain on renewed investor interest
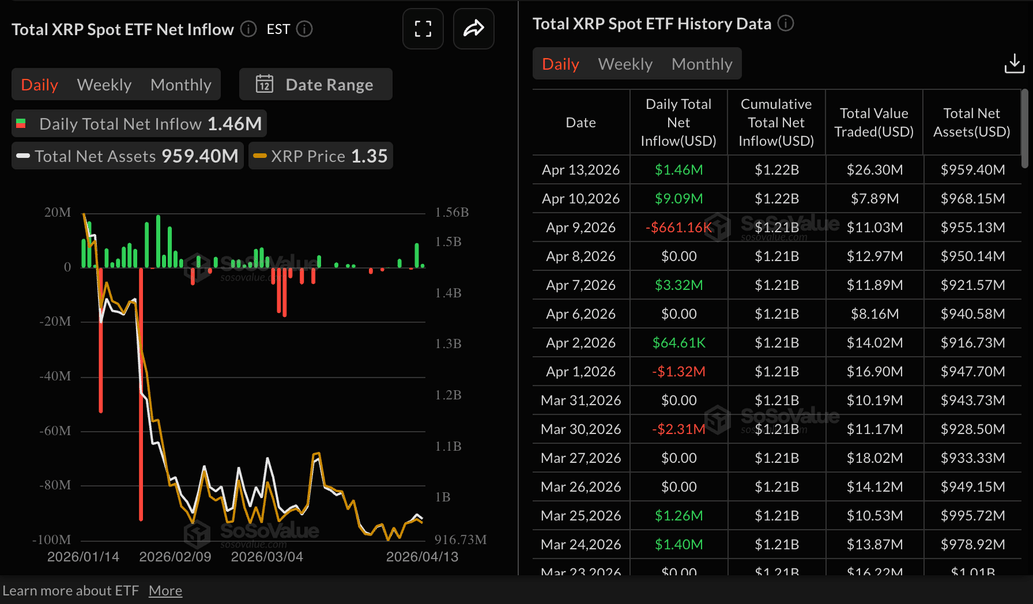
$XRP is experiencing a mild return in risk appetite from both institutional and retail market participants. US-listed $XRP spot Exchange-Traded Funds (ETFs) extended a two-day bullish streak, attracting $1.46 million in inflows on Monday and roughly $9.00 million on Friday.
Cumulative inflows now stand at $1.22 billion, with net assets under management averaging $959 million, according to SoSoValue data. If the risk-on sentiment holds and draws investor interest, $XRP could gain momentum, driving prices above $1.40.
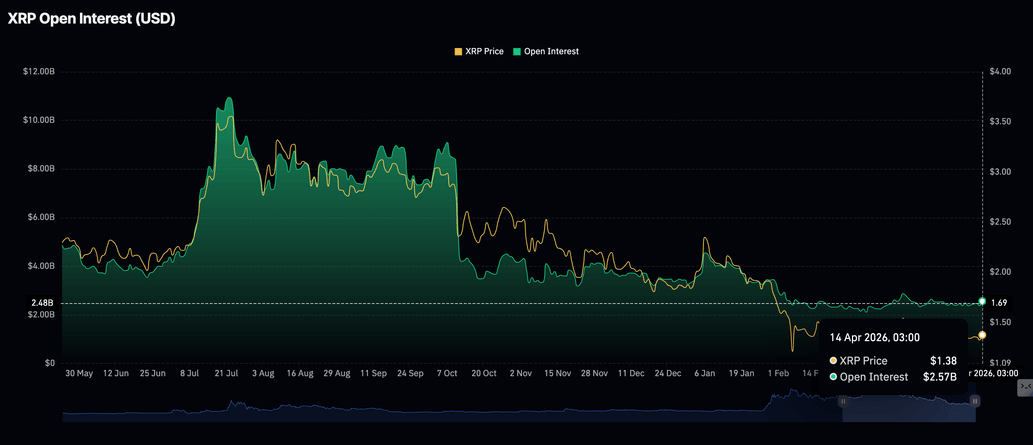
$XRP is also experiencing a mild influx of retail capital, as futures OI rises to $2.57 billion on Tuesday, from $2.38 billion the previous day.
A growing, liquid derivatives market could serve as a foundation for sustained price recovery, as seen in July, when OI peaked at a record $10.94 billion, and $XRP hit an all-time high of $3.66. This growth in derivatives demand underpins investor confidence and supports sustained price increases.
Technical outlook: $XRP struggles to break $1.40 resistance
$XRP trades around $1.37, maintaining a bearish near-term bias as it holds beneath the major moving averages. The remittance token remains capped first by the 50-day Exponential Moving Average (EMA) at $1.41, with the 100-day EMA at $1.56 and the longer-term 200-day EMA at $1.81 reinforcing a broader downside tone.
At the same time, the downward-sloping resistance trendline that could be reclaimed near $1.73 underscores the still-dominant selling pressure. The Relative Strength Index (RSI) at 51 on the daily chart is broadly neutral, suggesting a consolidation phase rather than a sharp downside move. Moreover, the Moving Average Convergence Divergence (MACD) remains modestly positive on the same chart, hinting that any recovery attempts could struggle while these overhead barriers remain intact.
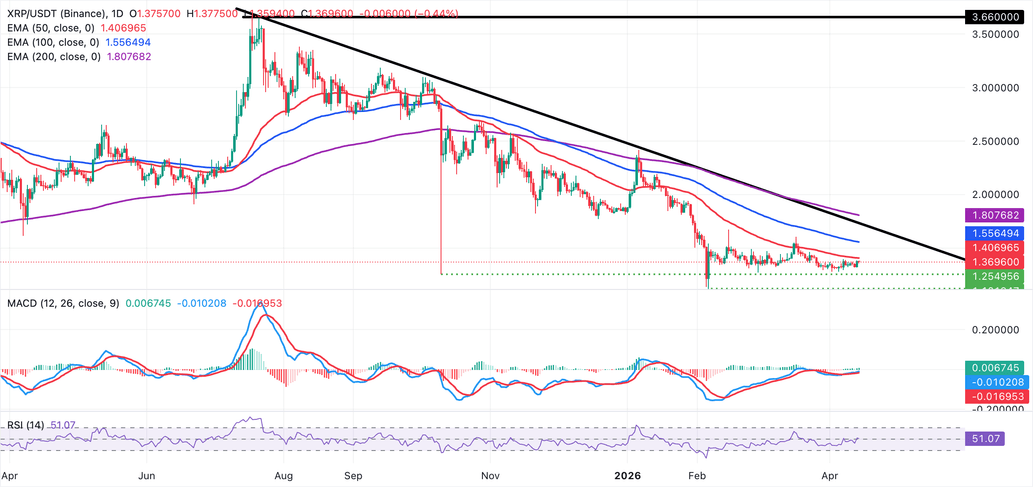
On the topside, $XRP's immediate resistance is at the 50-day EMA near $1.41. A daily close above this level would ease current pressure and open the way toward the 100-day EMA around $1.56. Further up, the descending trendline marks another barrier around $1.73, followed by the 200-day EMA near $1.81, which forms a broader supply zone that would need to be cleared to support a sustainable bullish reversal. The weekly open at roughly at $1.32 is $XRP's next key demand zone, followed by the pivotal $1.30 level.
(The technical analysis of this story was written with the help of an AI tool.)