The $XRP RSI currently eyes a golden cross at the bottom of a rising channel, triggering speculation that this could be the starting point of a rally.
$XRP’s downward price action has resulted in six consecutive monthly losses, with the crypto asset’s price down 25% year-to-date. Amid the downturn, $XRP has dropped to the bottom of a rising channel, while its weekly RSI eyes a golden cross.
Key Points
- $XRP’s 25% price drop this year has pushed it to the bottom of a multi-year rising channel on the weekly timeframe.
- This has resulted in a retest of the rising channel’s lower support trendline.
- Precious retests of the trendline in 2017 and 2024 preceded massive rallies for $XRP.
- The latest retest coincides with a potential golden cross on the weekly $XRP RSI, building the case for an upsurge.
$XRP Hits Rising Channel Bottom
This structure was highlighted by market pundit CW amid $XRP’s current struggles. For context, since pulling back from the $3.6 all-time high in July 2025, $XRP has continued to face turbulence alongside the rest of the crypto market, down 62% from the peak.
CW found that the ongoing market turbulence has pushed $XRP to the bottom of a rising parallel channel that has endured on the weekly chart for nearly a decade. Notably, the chart shows this channel visible as far back as 2017, with its three boundaries, the upper, middle, and lower trendlines, guiding $XRP’s price action.
Notably, $XRP’s decline to this bottom confirms the dominance of selling pressure in the market, as bears have successfully pushed it to retest the lower trendline of the channel, representing lows last seen during the November 2024 upsurge.
$XRP RSI Now Eyeing Golden Cross
In addition to $XRP’s drop to the rising channel’s bottom, data from CW’s chart also confirms that the weekly $XRP RSI now eyes a golden cross. For context, an RSI golden cross occurs when the RSI line moves above its moving average (the signal line).
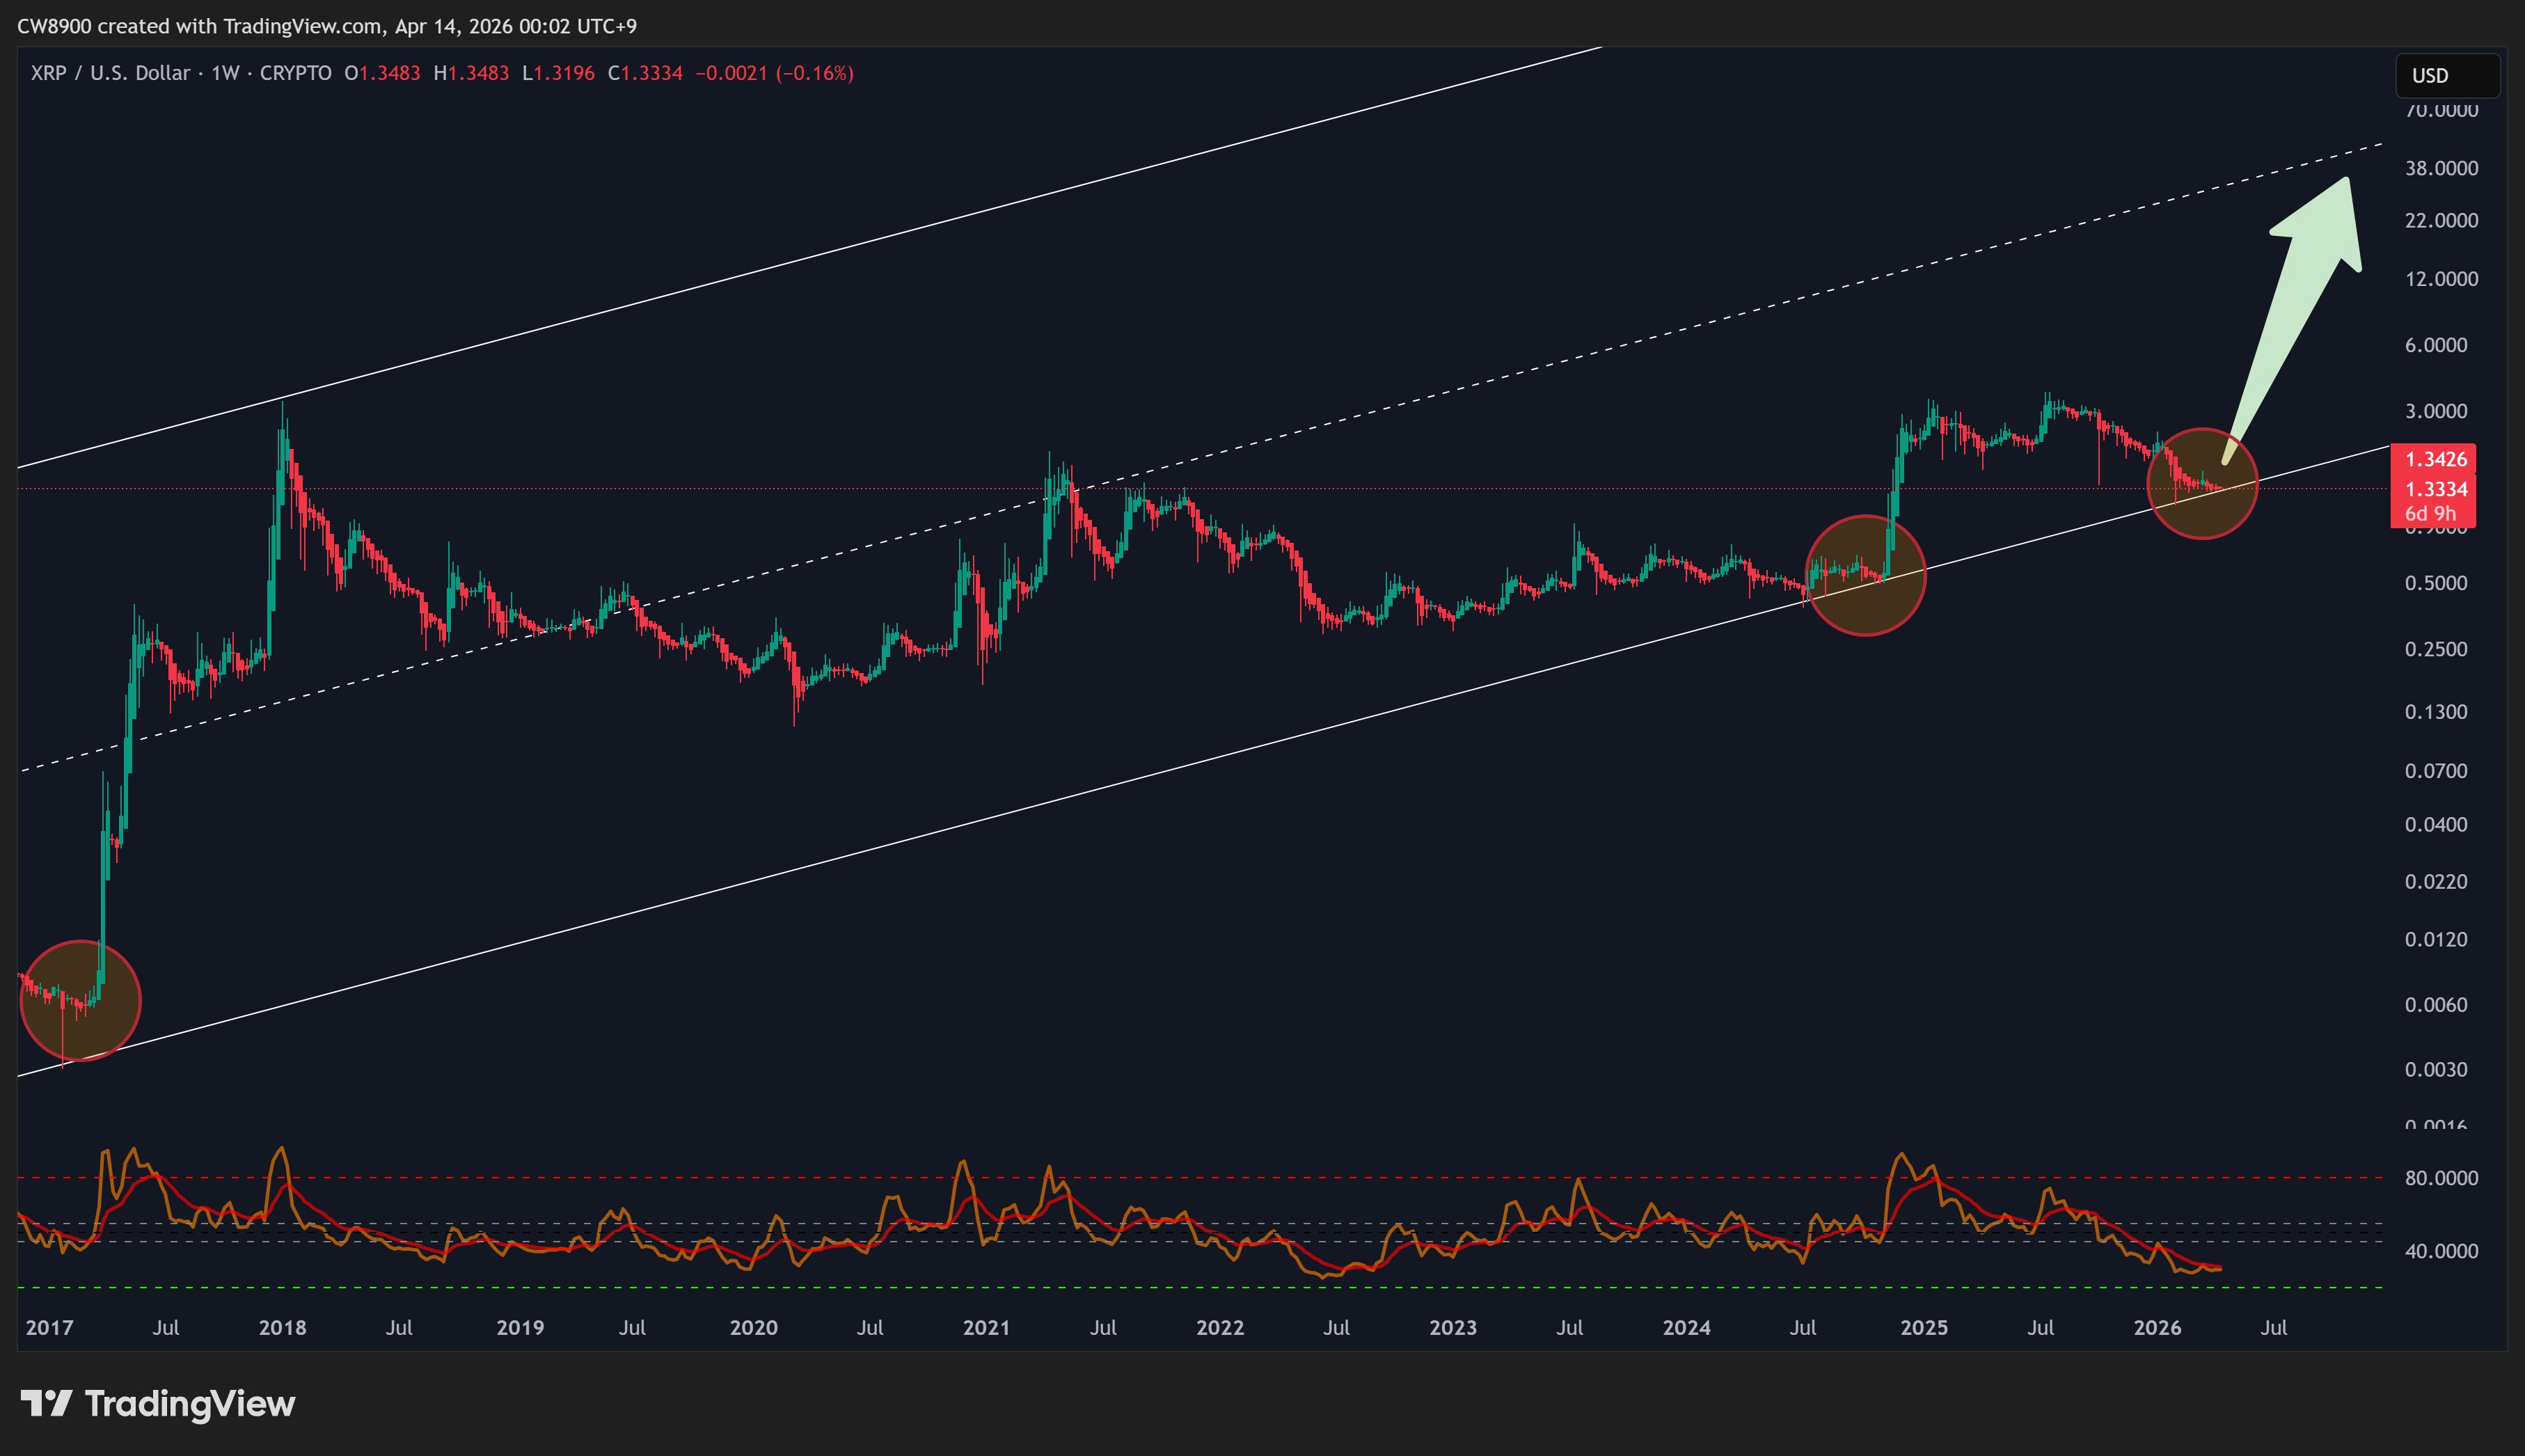
Such a golden cross indicates that the market may have begun witnessing increasing bullish pressure, leading to the RSI line rising faster than the signal line. At the time of CW’s analysis, $XRP traded for $1.34, with the golden cross yet to play out. As of this press, the cross has already occurred, with $XRP changing hands at $1.37.
The convergence of $XRP’s price at the bottom of the falling channel and the RSI golden cross makes an extremely bullish case for a potential upward price push. “This indicates the starting point of a rally,” CW remarked.
Historical Data Around the Falling Channel Bottom
Historical data surrounding how $XRP has reacted to the falling channel bottom also adds to this case. Specifically, each time $XRP retested the lower trendline of the falling channel, what followed was a rapid upward price action.
For instance, when $XRP’s price collapsed to $0.003 in January 2017, the asset retested this lower trendline. From here, an explosive surge occurred, pushing prices from the $0.003 low in January 2017 to the $3.31 peak by January 2018.
This pattern played out again in 2024. Specifically, when $XRP dropped to the $0.38 low in July 2024 and $0.5 in October 2024, it retested the falling channel’s lower trendline on both occasions. After the October 2024 retest, $XRP rebounded sharply, reaching the $3.4 high in January 2024. CW believes a similar pattern could emerge this time.