
- Chainlink price rose to highs of $9.42 as $LINK mirrored broader gains.
- Bitcoin’s surge to $74,500 could embolden $LINK bulls to challenge resistance around $10.
- The supply zone has capped upside for months.
Chainlink ($LINK) price is once again pressing into the robust supply zone near $10, with intraday gains to $9.42 outlining bulls’ intentions.
Despite sentiment around most altcoins being cautiously optimistic, largely due to what happens next after Bitcoin’s upswing to $74,500, gains for $LINK above $9.50 could see buyers target $12.
In this case, the 80% jump in daily volume may indicate an upbeat outlook, particularly if the bellwether asset $BTC pumps further.
Chainlink tests resistance amid broader market gains
The Chainlink price is up nearly 6% in the past 24 hours, joining the rest of the market in riding the upside momentum in $BTC.
However, $LINK has notably underperformed the wider market over the past months, repeatedly failing to secure a sustained break above the $9.40-$10 area.
The underperformance has held despite the project’s steady stream of ecosystem milestones and integrations.
Amid this outlook is the token’s rebound from a nearby demand zone, but it continues to face heavy pressure as bulls pare gains seen as prices rose to $9.42.
The region thus remains key to sellers who have consistently faded rallies and defended prior breakdown levels.
At the same time, analysts view $10 as a decisive short‑term line in the sand: bulls need a clean daily close above this level.
If this is backed by strong volume, it could flip market structure from defensive to constructive and open a path toward the $11.5-$12 region.
Until that happens, the prevailing pattern of lower highs since November keeps bulls on the back foot and allows bears to reassert control on every test of resistance.
Chainlink price: Technical analysis
On the technical front, Chainlink is trading near a key inflection zone, with several indicators hinting that downside momentum is waning even as resistance remains firm.
Lower time‑frame charts show prices attempting to build a base above recent demand.
$LINK’s Bollinger Bands setup indicates the bands have compressed significantly, a classic precursor to a reversal.
Meanwhile, higher time frames highlight constructive setups, including a golden cross pattern.
The MACD continues to hover around or slightly above the zero line, a posture that typically accompanies early trend reversals rather than deep distribution.
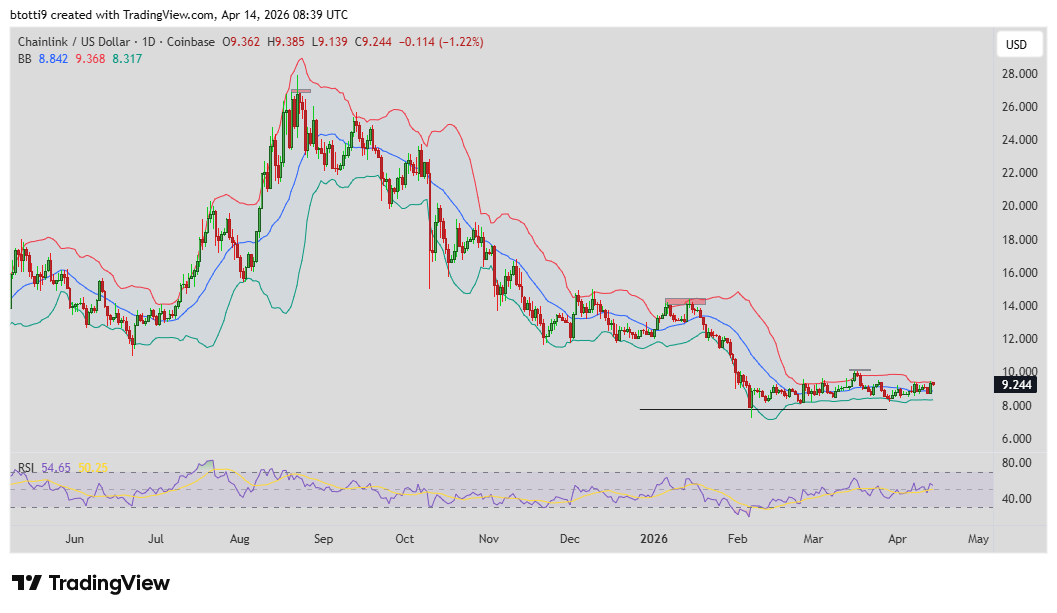
For the immediate outlook, traders are likely to watch immediate resistance at $9.50-$10.
The area marks the region where repeated rejections have formed a tight supply wall.
Near-term support lies around the $8 zone, which may be revisited if a broader pullback hits crypto.