coinedition.com

$XRP continues to trade within a fixed structure as analysts monitor both short-term weakness and a broader multi-year pattern controlling its trend. At the time of writing, $XRP was trading at $1.32, marking a 4.57% decline over the past month after reaching a mid-March high near $1.60.
The pullback has followed a sequence of lower highs and declines, with price stabilizing around $1.40, then falling to $1.28 and recovering slightly. This movement has occurred alongside a 0.57% drop in market capitalization to $81.41 billion and a 9.57% decline in 24-hour trading volume to $1.78 billion, pointing to reduced market activity during the period.
Analysts Identify Long-Term Triangle Formation
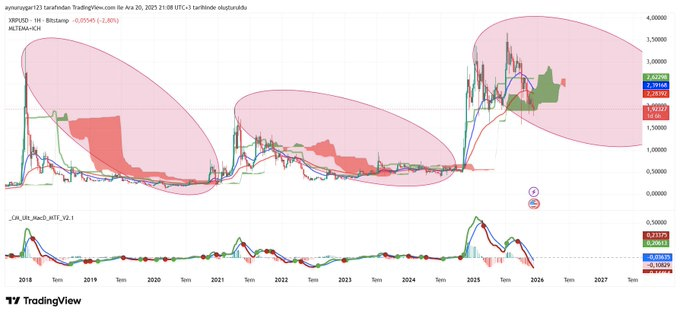
According to data shared by Ali Charts, a crypto analyst, a long-term ascending triangle has developed over roughly nine years on the monthly timeframe. The structure is defined by repeated rejections near a horizontal resistance level around $3.30, while a rising trendline continues to form higher lows from earlier cycles.