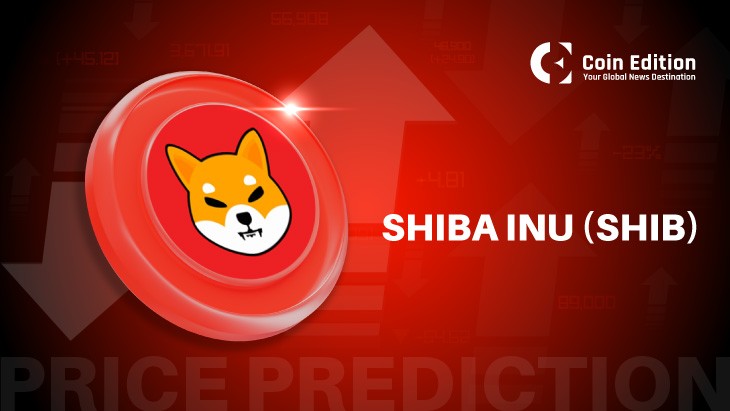
$SHIB trades at $0.0000579 on April 13, up 0.52%, with burns jumping 339.87% in 24 hours and price still unable to clear the SAR at $0.0000616 or the upper Bollinger Band at $0.0000613.
$SHIB Daily Chart: Three Resistance Layers Stack Between $0.0000613 And $0.0000630
The Bollinger Bands have compressed tightly around current price since February. Upper band at $0.0000613, middle band at $0.0000592, lower band at $0.0000571. Price at $0.0000579 sits between the middle and upper bands, closer to the upper end, with the SAR at $0.0000616 sitting just above as the first resistance layer.
Above the SAR, the descending trendline from the September peak slopes down through $0.0000620 to $0.0000630, adding a third ceiling just beyond. Every rally since October has failed before clearing any of these levels. A daily close above $0.0000616 clears the SAR and upper band together. Losing the lower band at $0.0000571 puts the channel floor at $0.0000500 back in play.
Key levels for April 14:
- Lower Bollinger Band: $0.0000571
- Middle Bollinger Band: $0.0000592
- Upper Bollinger Band: $0.0000613
- SAR resistance: $0.0000616
- Descending trendline: $0.0000620 to $0.0000630
- Channel floor: $0.0000500
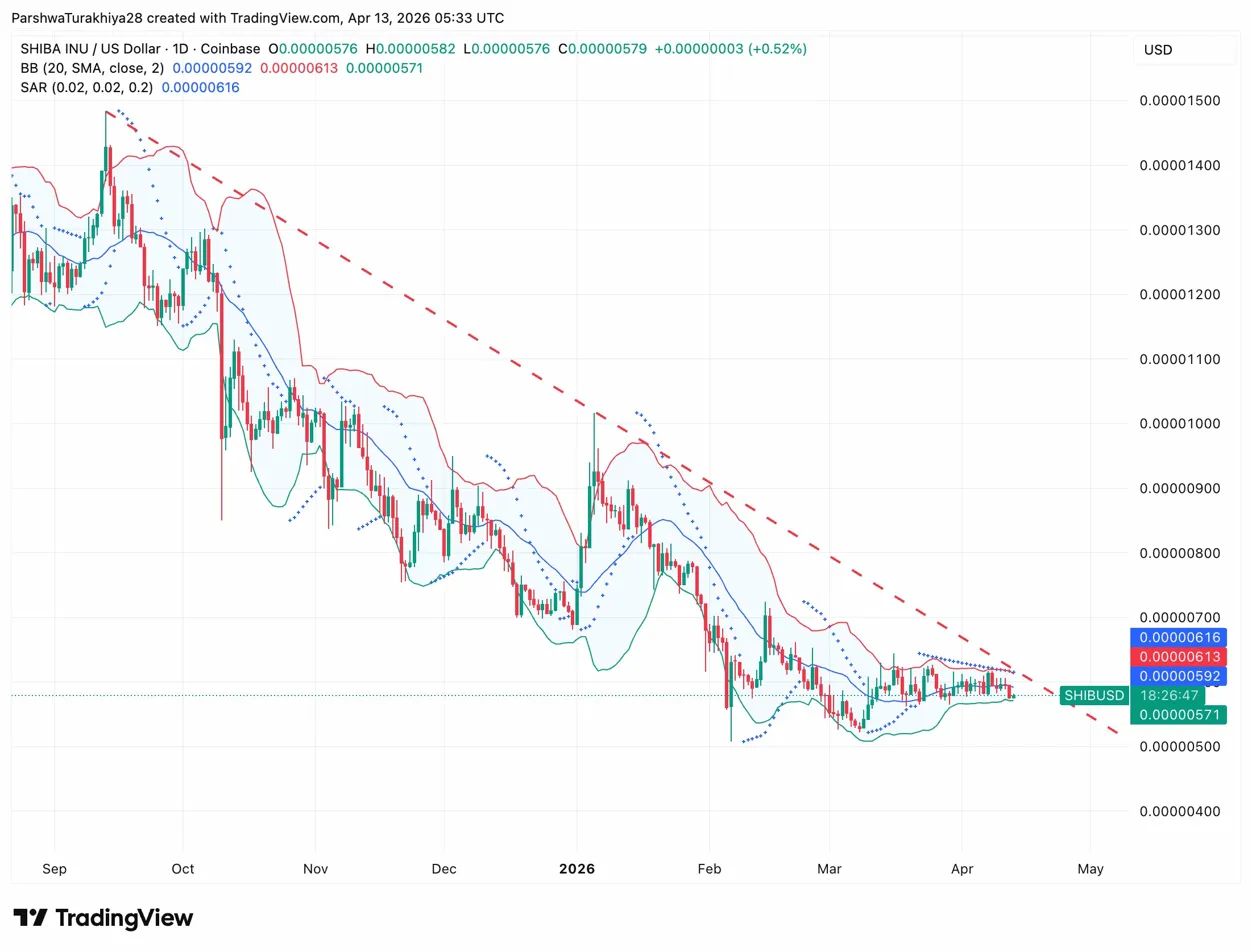
Burns Jumped 339% In 24 Hours But The Weekly Trend Tells A Different Story
The 24-hour chart opened near 1M $SHIB per hour at 12:00, dipped briefly around 13:00, then climbed to 1.5M per hour by 20:00 before falling sharply and hitting near zero by 03:00. The 339.87% headline is real, but the activity was concentrated in a narrow evening window.
Zooming out to the 7-day view, April 10 stands as the week’s peak at roughly 11.5M $SHIB burned in a single day. Every day since has come in lower, with April 13 trending near zero as the chart ends. The 7-day rate is up 31.35%, but the direction within the week is clearly lower. Burns need to hold above 5M $SHIB per day to keep the supply narrative credible. They are not there right now.
$SHIB Derivatives: Longs Absorbing All The Pain At Resistance
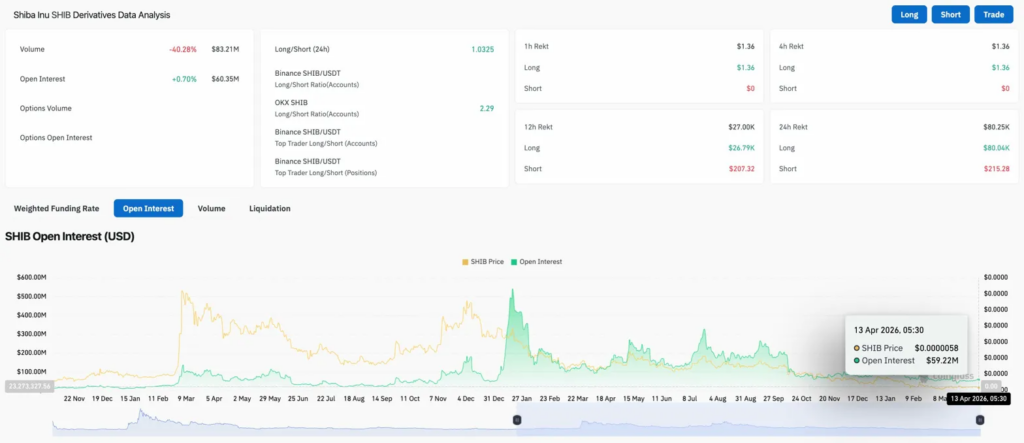
Volume fell 40.28% to $83.21M while OI rose 0.70% to $60.35M. Positions are holding, not closing. Long/short ratio at 1.0325 leans slightly long, with OKX accounts sitting heavily long at 2.29.
Longs absorbed $80.04K in 24-hour liquidations against $215.28 for shorts. Buyers are getting stopped out at the SAR and upper band on every attempt. OI at $59.22M is near its lowest level since before the January rally, down from above $500M at the cycle peak, leaving very little leverage to fuel a breakout even if price clears resistance.
$SHIB Price Prediction: April 14 Outlook
- Upside: Daily close above $0.0000616 clears the SAR and upper Bollinger Band together. Burns holding above 5M $SHIB per day through April 14 keeps the supply narrative alive. First target above the SAR is the descending trendline at $0.0000620 to $0.0000630, then the channel midline near $0.0000700.
- Downside: SAR and upper band hold as resistance, burns flatline overnight again, and $SHIB slips toward the lower Bollinger Band at $0.0000571. A daily close below $0.0000571 opens the channel floor at $0.0000500 with nothing in between.