A long-term $XRP chart pattern is drawing renewed attention, with a breakout from a multi-year consolidation structure sparking optimism.
Notably, $XRP is currently testing a key breakout level that could shape the next phase. As such, a successful retest event would ignite an explosive move, potentially pushing prices to unprecedented levels.
Key Points
- $XRP has just secretly handed enthusiasts the “breakout of the decade” after moving above a long-term symmetrical triangle.
- The triangle has been forming since the January 2018 peak near $3.35 before $XRP broke out in November 2024.
- Notably, the current setup shows $XRP retesting the breakout.
- The next step after a successful retest is a sustained price expansion, potentially targeting $21.
$XRP Breakout from Long-Term Structure
ChartNerd, a widely followed technical analyst, identified this trend in a recent X post. In the analysis, he claimed that $XRP has just secretly handed enthusiasts the “breakout of the decade,” citing the asset’s move above a long-term structure.
The accompanying chart shows a large symmetrical triangle that formed over several years before $XRP broke out in late 2024. The triangle started taking shape after $XRP dropped from the January 2018 peak near $3.35, forming lower highs and higher lows until November 2024, when the Donald Trump-inspired rally forced a breakout.
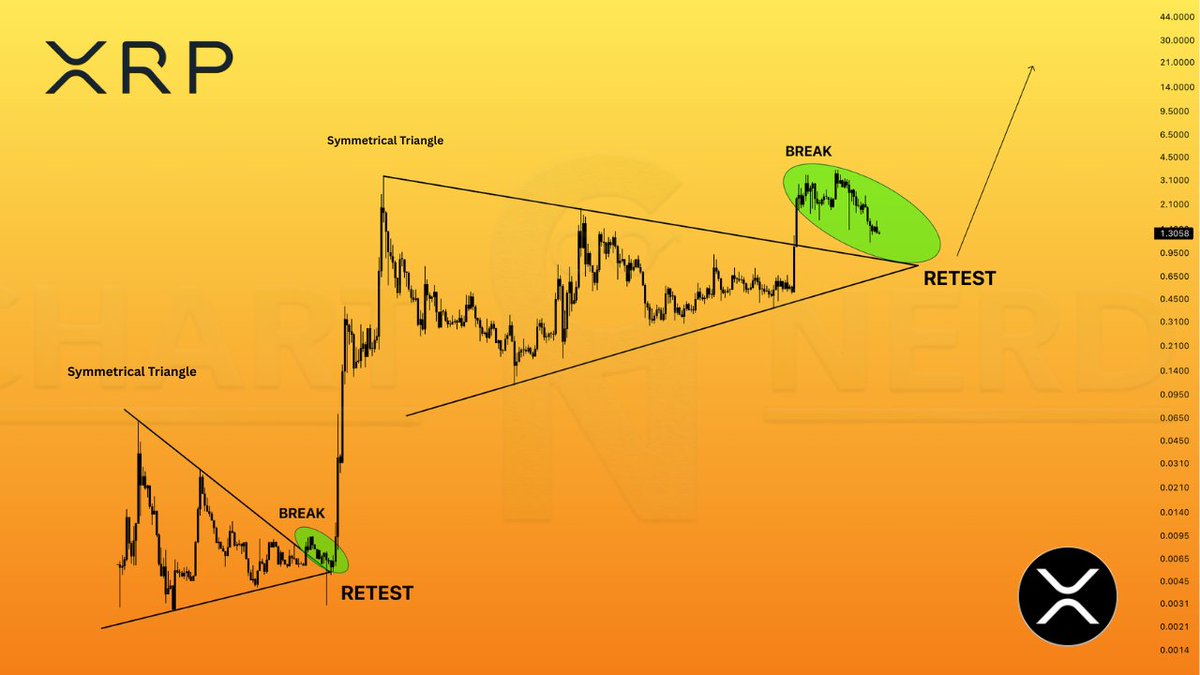
A strong rally followed this move, eventually peaking at the all-time high of $3.66 in July 2025. Since then, $XRP has entered a pullback phase, with price now hovering near the upper region of the former triangle.
Breakout Structure Now Faces Critical Retest
The current setup shows $XRP retesting the breakout zone. This area previously acted as a resistance before the breakout, and how the altcoin handles this phase is critical.
Moreover, the structure resembles earlier formations seen in previous cycles. A smaller, symmetrical triangle formed between 2013 and 2017, with the $XRP price compressing within it before breaking higher.
In that cycle, it retested the structure’s neckline, and a successful event confirmed the breakout. Consequently, a stronger upward move followed, pulling $XRP to the January 2018 high of $3.35.
Currently, $XRP is trading at $1.34, up 1.7% in the past seven days. According to the chart, the triangle’s neckline lies near $0.85. This suggests that prices could drop lower to meet this support, aligning with an outlook from CasiTrades. It bears mentioning that $XRP does not need to fully touch the symmetrical triangle’s neckline to complete a retest.
$XRP Target After Retest
ChartNerd noted that the sequence is clear: a compression within a triangle, followed by a breakout, a retest, and then a sustained move higher. This shows that the next step after a successful retest is a sustained price expansion.
If $XRP finds support at the current level and begins to build momentum, it could target unprecedented prices as outlined in the chart. This could see the coin rally to $21, representing a 1,467% increase from the current market price.
Conversely, failure to hold the retest zone would weaken the setup and introduce the possibility of a deeper correction.