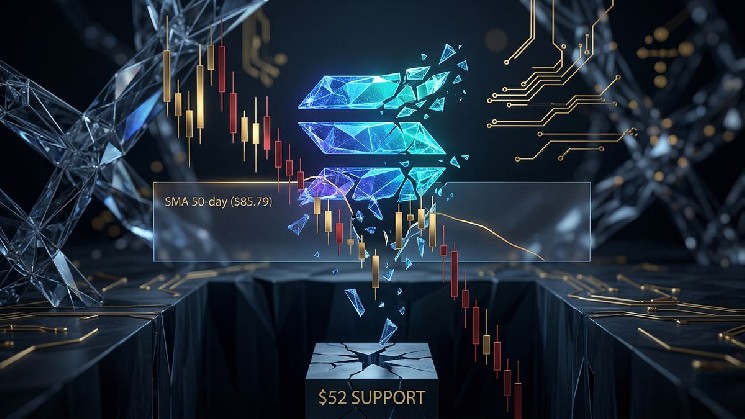
- Solana is currently trading in a critical range between $79 and $81, sitting dangerously below its 50-day Simple Moving Average (SMA) located at $85.79.
- Technical analysis from @alicharts identifies a “consolidation phase” that preceded major sell-offs in November 2025 and January 2026, suggesting a cyclical pattern.
- Failure to reclaim the key resistance level of $86 could cause the digital asset to face a 35% bearish adjustment, projecting its value toward support at $52.
Solana is once again under the microscope of the crypto market. Analysts have detected a technical formation that, according to the ecosystem’s history, precedes significant collapses in market price.
At the time of writing, Solana was trading below the 50-day SMA, with a shaky capitalization, while the RSI reflects a lack of buying momentum at higher levels.
However, this is not an unfamiliar setup for investors. @alicharts revealed on their X account that this is the third time since October 2025 that the asset has entered this sideways drift zone after losing an essential moving support.
I’ve been tracking a specific structural pattern for Solana $SOL that has been remarkably consistent since October 2025.
— Ali Charts (@alicharts) April 8, 2026
It’s a three-step cycle that seems to repeat every time we lose momentum.
The Anatomy of the Pattern:
• The Reclaim: $SOL rallies and manages to close… pic.twitter.com/Xj6GftpKun
Previously, as seen in the event that occurred in November 2025, this apparent calm turned out to be a bull trap, culminating in a bearish resolution that marked new local lows.
Later, in January 2026, the market replicated this behavior: a brief recovery attempt followed by a consolidation that preceded another massive sell-off in global exchanges.

The $86 Threshold: The Frontier Between Recovery and Collapse
In his analysis, Ali Martínez emphasizes that the current sideways movement does not represent stability, but rather a pressure accumulation phase that is usually resolved with a bearish leg.
To exit the red zone, Solana needs a decisive daily close above $86, a level that would act as confirmation of a short-term trend change.
However, the current technical landscape shows persistent weakness, as every time the price has left the $79-$81 range in the recent past, it has done so to the downside.
A drop toward $52 would represent a severe contraction, erasing the gains accumulated during the brief recovery in March; furthermore, confidence in the DeFi sector would be impacted.
Traders remain cautious, as the three-step pattern—rally, loss of support, and sideways drift—seems to be completing with alarming mathematical precision on the network.
Solana’s inability to reclaim its main moving average suggests that the risk of a double-digit drop is high, keeping the market on maximum technical alert.