
As of April 9, 2026, the Solana ecosystem is at a crossroads, attempting to decouple from a month of bearish pressure that has seen the asset slide 5.4%. Despite a localized 5.5% weekly recovery, the network is absorbing the shockwaves of the $285 million Drift Protocol drain—the largest security failure of the year.
However, Solana Foundation’s aggressive pivot toward the “STRIDE” security framework and a milestone achievement of 10 billion quarterly transactions are providing the fundamental tailwinds needed to maintain a $47.73 billion market capitalization.
Hardening the ‘Financial Highway’
The network caught the attention of the community this week with the official rollout of STRIDE (Solana Trust, Resilience and Infrastructure for DeFi Enterprises). Launched on April 6, 2026, in collaboration with Asymmetric Research, the program represents a transition from periodic audits to a tiered, ongoing threat management system.
The STRIDE initiative was fast-tracked following the Drift Protocol exploit, which saw North Korean-linked actors gain admin control to drain over 50% of the protocol’s total value locked. By offering expert security guidance at no cost to developers, the Foundation is aiming to professionalize the ecosystem’s defensive posture.
Analysts suggest that STRIDE could set a new benchmark for high-performance chains, potentially reversing the “capital flight” seen earlier this month.
While on-chain data shows $18.2 billion in realized cap has exited the ecosystem since its October peaks, the record high of 166.9 million unique holders suggests a massive, resilient retail base that is currently absorbing the institutional sell-side pressure.
The Symmetrical Coiling Phase
Solana price chart on a 15-minute time frame shows a recovery from the $79 demand floor, where $SOL has established a robust ascending green support line. The trendline has caught every minor dip over the last 48 hours, leading the price toward its current $83.42 valuation. However, any movement upward is stopped by a red descending resistance line that has capped every breakout attempt since the start of the week.
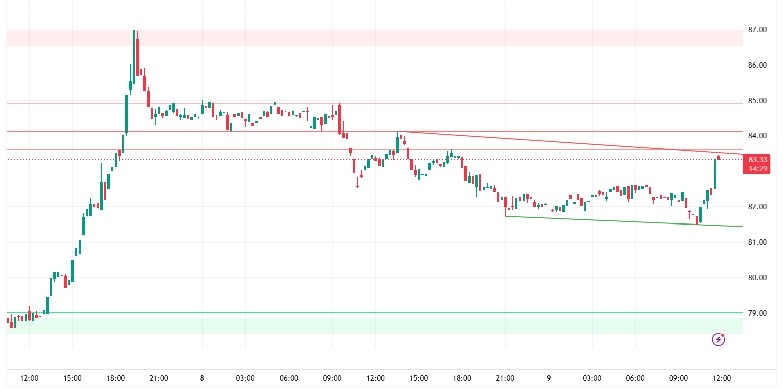
The visual data highlights a formidable “pink zone” of supply between $86.50 and $87.50, which coincides with the 20-day Exponential Moving Average (EMA) at $86.80. The 20-day EMA is acting as the primary hurdle for a trend reversal. $SOL is now approaching the peak of this symmetrical triangle, suggesting that a significant volatility expansion is imminent.
With $2.74 billion in 24-hour volume, the market has enough liquidity to force a definitive move, but a sideways market shows a struggle between buyers and short-term sellers.
The Relative Strength Index (RSI) on the lower timeframes is currently hovering at 54, reflecting a neutral bias that allows for a move in either direction. For the bulls to take control, a high-volume candle must clear the red resistance line and flip the $87 zone into support.
However, the fanning out of the shorter-term EMAs suggests that the asset is currently using the $82.50 level as a dynamic pivot point. A failure to hold this mark would likely trigger a retest of the psychological $80 support.
If Solana price can successfully clear the $87.00 resistance on high volume, the next major target is the $93.00 supply cluster. A reclaim of this level would effectively invalidate the 5.4% monthly slide and signal a move toward the $100.00 psychological milestone as the STRIDE security framework boosts investor confidence.
A quick slide toward the $79.00 structural floor is likely if the green ascending support line near $82.00 fails to hold. Our price prediction suggests that if the price falls below this level, it could fall even further to a correction toward $73.00.