
Bitcoin (BTC), Ethereum (ETH), and Ripple (XRP) are currently in the red as the broader crypto market pauses after its recent rally.
However, $ONDO, the native coin of the Ondo Finance ecosystem, is one of the worst performers among the top 100 cryptocurrencies by market cap.
The coin is down 6% in the last 24 hours and faces further downward pressure, with the bears now targeting the $0.2400 support level.
The derivatives data support the current bearish outlook, with intense long liquidations adding further confluence to this narrative.
Technically, the real-world asset (RWA)- focused crypto is losing ground and risks a further correction in the near term.
Derivatives data indicate declining retail demand
The core driver behind $ONDO’s bearish performance over the past few days is the declining retail demand.
Currently, the leverage market anticipates further declines in $ONDO as the uncertainty from the US-Iran ceasefire deal weighs on the broader cryptocurrency market.
Data obtained from CoinGlass shows that $ONDO futures recorded a total liquidation of $99,730 over the last 24 hours, led by $93,410 in long liquidations, indicating an intense sell-side pressure in the spot market.
The massive liquidation resulted in a 6% decline in the $ONDO futures Open Interest (OI) to $81.84 million over the same period, indicating reduced market participation.
The sharp liquidation led to a 5% decline in the $ONDO futures Open Interest (OI) to $86.01 million over the same period, indicating reduced market participation.
Furthermore, $ONDO’s funding rate dropped to -0.0007% and the long-to-short ratio to 0.9342, both of which suggest a bearish inclination among traders.
$ONDO could retest $0.2400 support amid downside pressure
The $ONDO/USD 4-hour chart is bearish and efficient as Ondo is down 6% in the last 24 hours. Currently, $ONDO is trading below the 50-day Exponential Moving Average (EMA) at $0.2700
With the recent decline, the 100-day EMA at $0.3186 and the 200-day EMA at $0.4420 remain well above the market, reinforcing a broader downside-skewed structure.
If the bulls regain control, they would encounter immediate resistance at the 50-day EMA of $0.2700. An extended rally would bring the $0.2968 resistance level into focus in the near term.
The momentum indicators align with the bearish market outlook. The Relative Strength Index (RSI) on the 4-hour chart reads 48, below the 50 midline.
The Moving Average Convergence Divergence (MACD) indicator prints a negative reading below zero, hinting at persistent selling pressure in the near term.
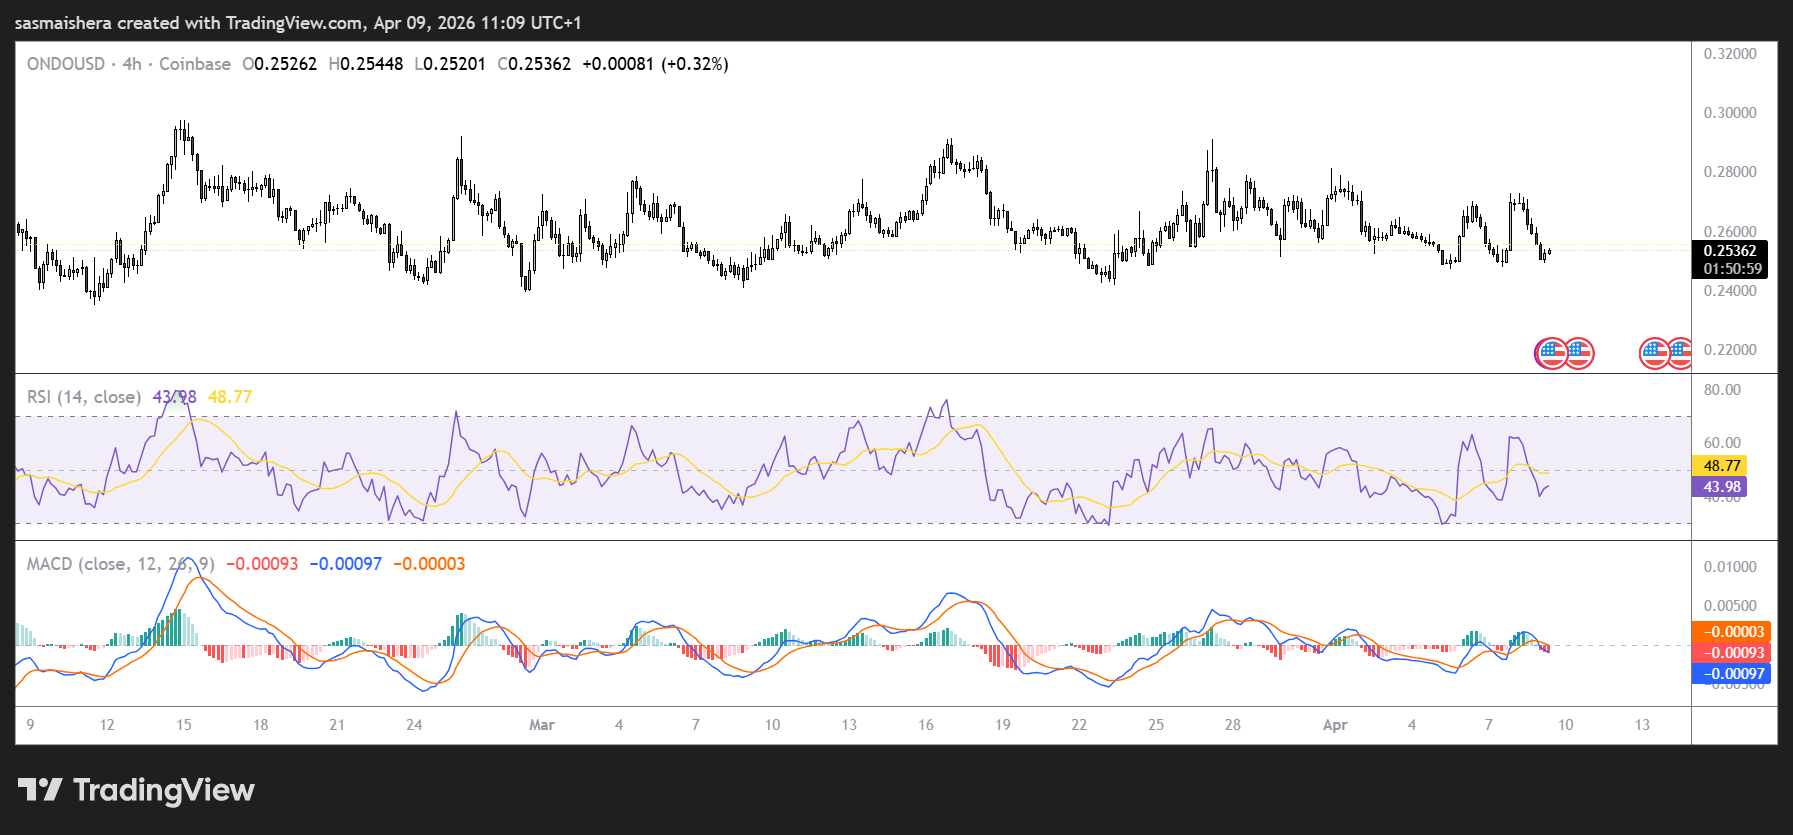
However, if the selloff persists, $ONDO will likely retest the February 9 low of $0.2405 over the next few hours or days.
The February 6 low of $0.2018 is also another target for the bears.
Consequently, a drop below the $0.2000 psychological level would significantly increase the downside risk.
The market conditions remain fragile at the moment. If the ceasefire deal holds, then Bitcoin and other major coins like $ONDO could record further gains over the next few days.