
Traders are navigating a fragile bounce as the broader crypto market stays risk-off, making this a nuanced moment for any Solana price strategy.
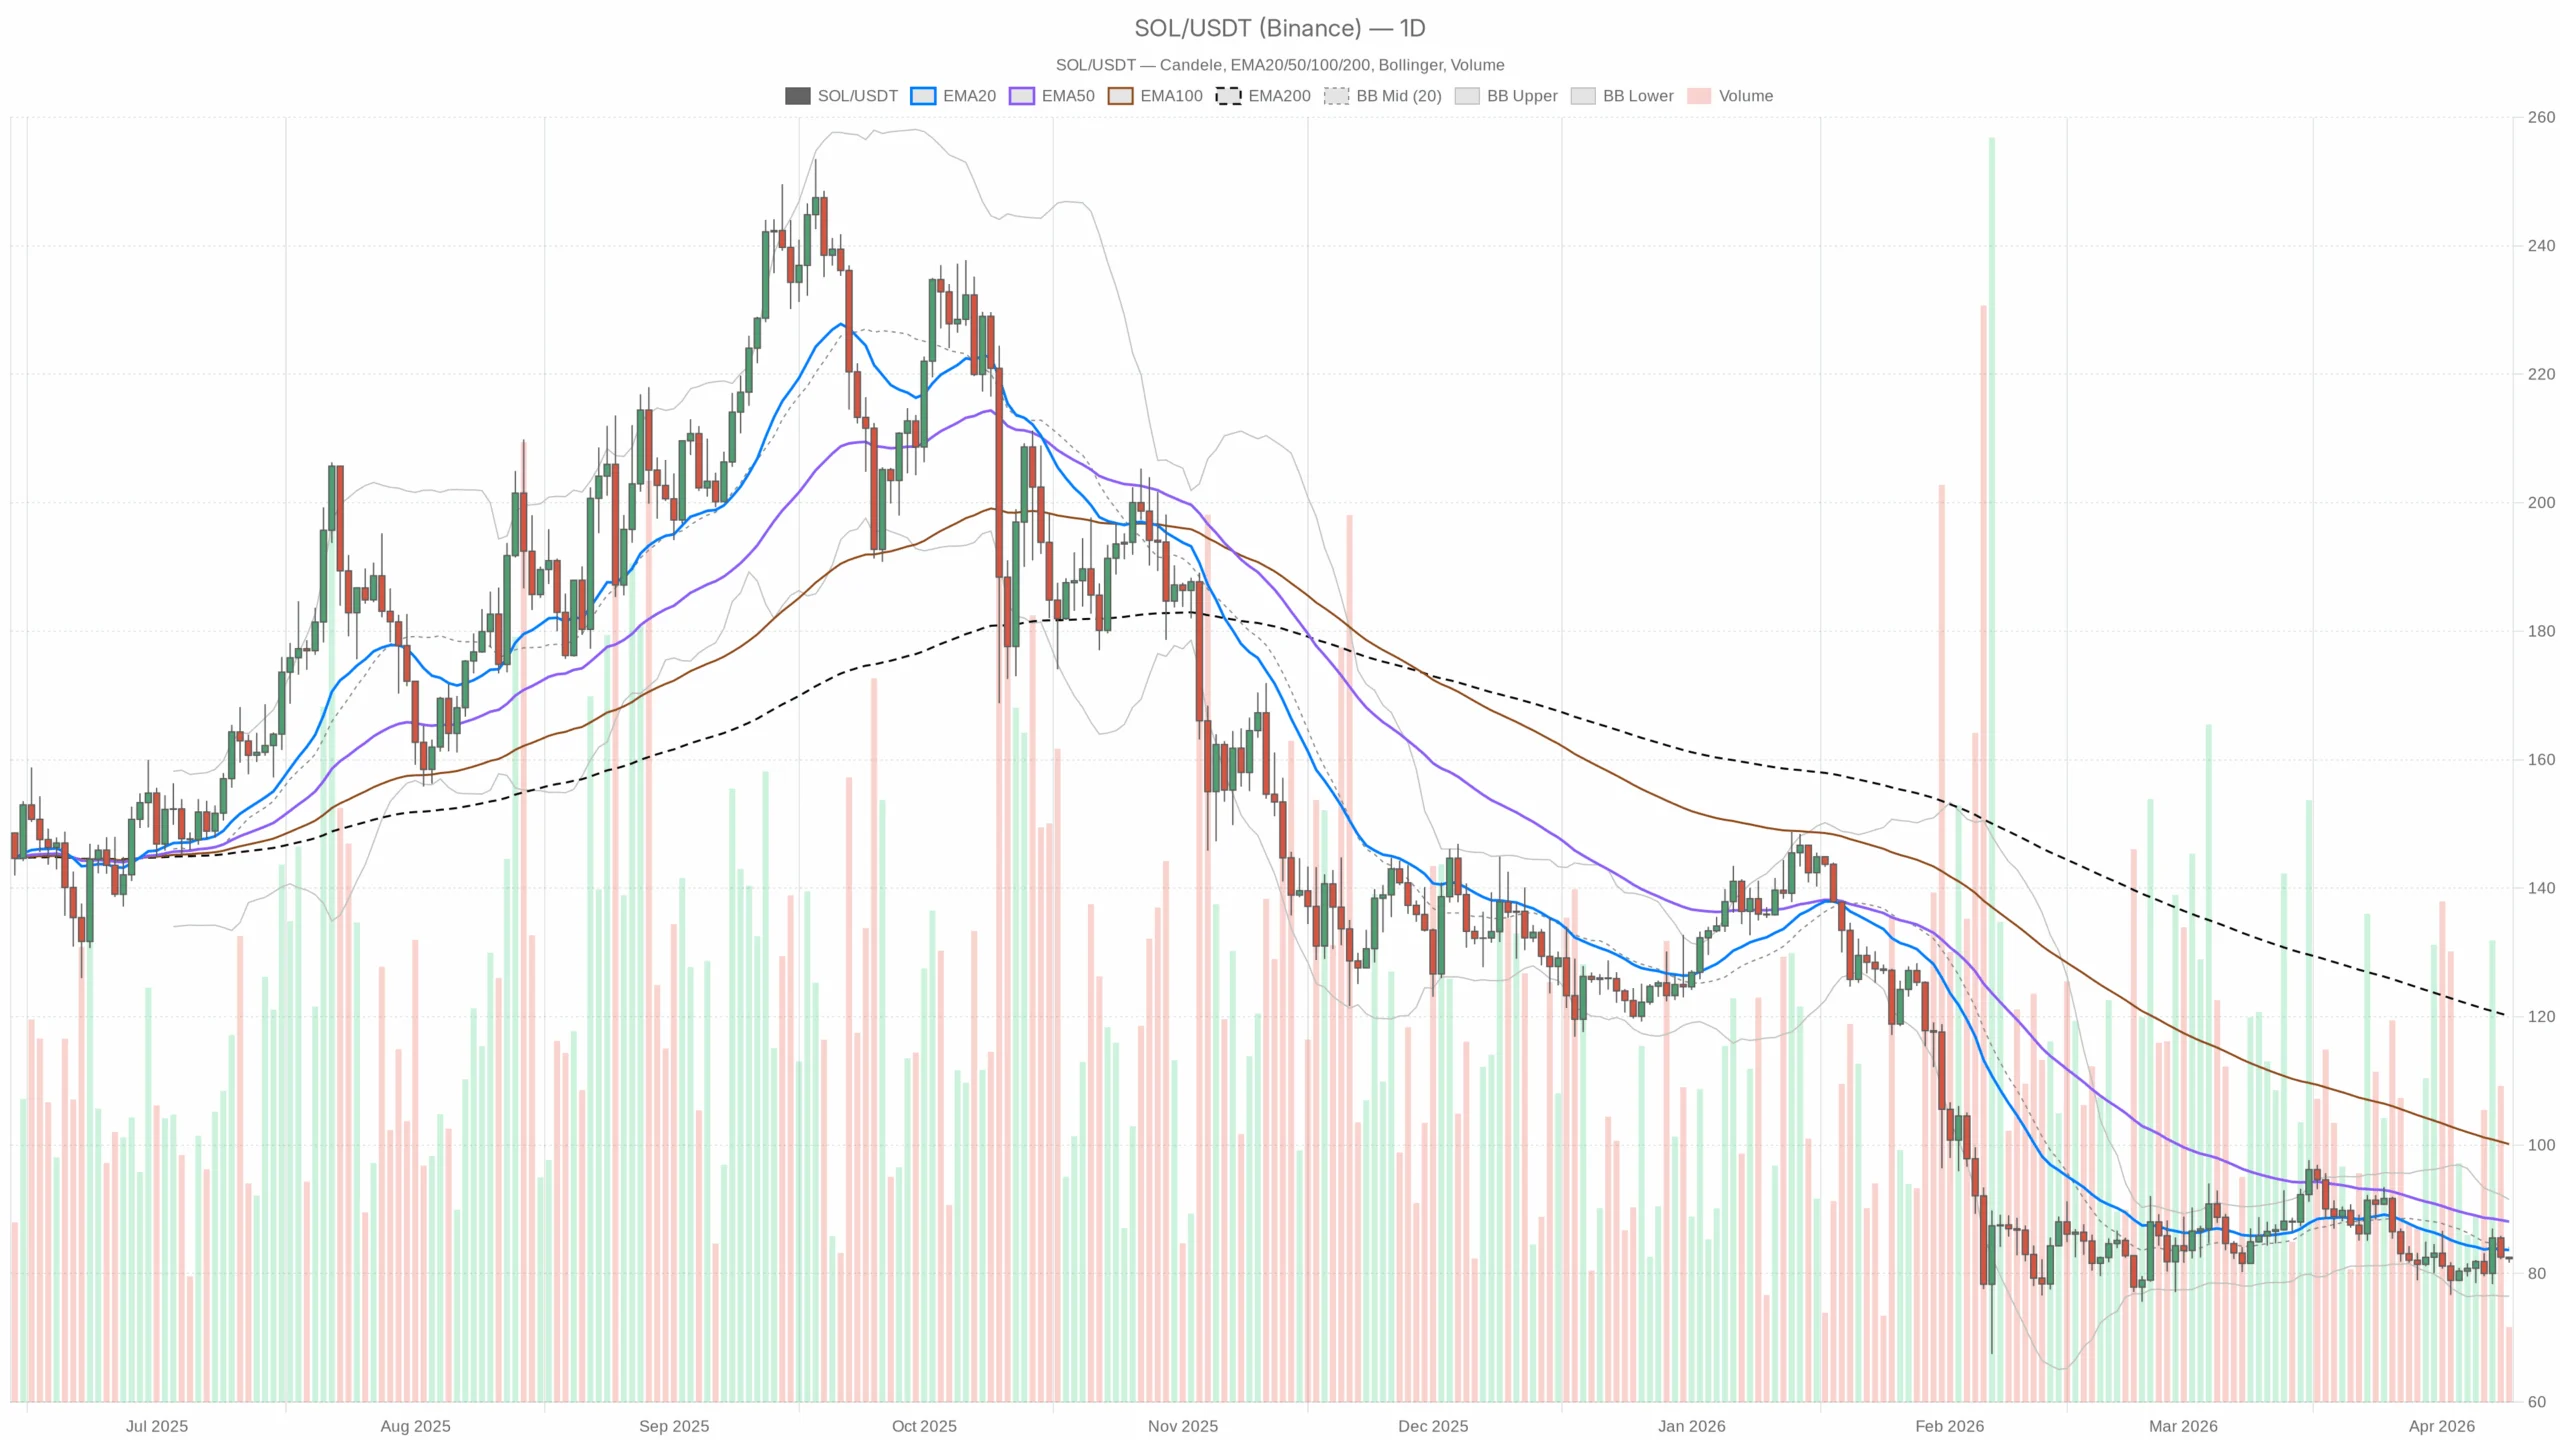 $SOL/$USDT daily chart with EMA20, EMA50 and volume”
loading=”lazy” />
Solana price: where we are now
Solana ($SOL) is trading around $82.3, sitting just above a key daily pivot at $82.2, in a market backdrop of Extreme Fear and a risk-off crypto environment (BTC dominance near 57%, total market cap down ~1.3% in 24 hours, volumes down sharply). That combination signals a capital-preservation phase, not a chase-the-rally phase.
On the daily chart, $SOL remains in a bearish regime, trading below all major EMAs and well under the prior trend base around the 200-day EMA near $120. Shorter timeframes, however, show early attempts to stabilize above $80, with intraday structure more neutral than outright bearish. For now, this is a weak bounce inside a broader downtrend.
The dominant force is simple: risk aversion. The recent $280 million hack of DeFi platform Drift on Solana, heavy pullbacks in Solana DEX fees across Raydium and Orca, and a fearful sentiment index at 14 all point to a market that is reluctant to add exposure on the first dip. Any bullish case from here has to overcome that psychological backdrop, not just print a neat technical pattern.
My base case, given the daily structure, is a mildly bearish-to-neutral scenario. Downside pressure remains the default, but the $80–82 band is turning into an important battleground that could seed a more meaningful recovery if buyers step up.
Daily timeframe (D1) – macro bias: bearish, but not capitulated
Trend and EMAs
– Price: $82.32
– EMA 20: $83.67
– EMA 50: $88.10
– EMA 200: $120.10
– Regime tag: bearish
$SOL is trading below the 20-day, 50-day, and 200-day EMAs, with all of them stacked above price. The 20-day is below the 50-day and both are far below the 200-day. That is a classic downtrend structure. Rallies are, by default, suspect until price can reclaim at least the 20-day and 50-day EMAs.
Interpretation: structurally bearish. The burden of proof is on the bulls to reclaim the $84–90 area before any talk of a lasting trend reversal makes sense.
RSI (14)
– RSI 14: 46.0
RSI is just below the midline, neither oversold nor overbought. The selling pressure that pushed $SOL down has cooled off, but there is no evidence yet of strong accumulation.
Interpretation: momentum is weak but not exhausted. This is more in line with a pause in a downtrend than with a washed-out bottom.
MACD
– MACD line: -1.59
– Signal line: -1.71
– Histogram: +0.12
MACD remains in negative territory but the line is now slightly above the signal, producing a small positive histogram.
Interpretation: bearish momentum is easing, with early signs of a potential daily bounce. However, the move is tentative and nowhere near a confirmed trend shift.
Bollinger Bands
– Mid band (20-day basis): $84.02
– Upper band: $91.53
– Lower band: $76.50
– Price: just below the mid band
Price has drifted back toward the middle of the bands after weakness toward the lower side. That is typical of a market digesting a prior move rather than trending strongly.
Interpretation: volatility is contained, and $SOL is in a consolidation pocket between roughly $76.5 and $91.5. A close outside this range would likely define the next leg.
ATR (14)
– ATR 14: ~$4.00
Daily average range near $4 on an $82 asset implies roughly 4.8–5% typical intraday swings.
Interpretation: volatility is elevated but not extreme by Solana standards. It is enough to punish tight stops, but not a panic regime.
Daily pivot levels
– Pivot point (PP): $82.23
– First resistance (R1): $82.76
– First support (S1): $81.79
Price is trading almost exactly on the daily pivot, with R1 and S1 tightly clustered.
Interpretation: the market is in balance right now. A decisive move away from this $82 pivot will define whether the next impulse is higher or lower.
1-hour timeframe (H1) – neutral, leaning heavy
On the hourly chart, $SOL is trying to stabilize, but the short-term momentum is still soft.
Trend and EMAs
– Price: $82.32
– EMA 20: $82.68
– EMA 50: $82.52
– EMA 200: $81.71
– Regime tag: neutral
Price sits sandwiched between the 50-EMA and 20-EMA, while still above the 200-EMA. The short-term trend has flattened out after prior selling, but the inability to reclaim and hold above the 20-EMA shows a lack of strong intraday buying.
Interpretation: short-term structure is neutral with a slight downside bias. This is consolidation after a drop, not yet a strong reversal pattern.
RSI (14)
– RSI 14: 44.4
Hourly RSI below 50 points to modest intraday selling pressure.
Interpretation: bears still have the upper hand intraday, but there is no sign of a momentum crash. This is controlled pressure rather than capitulation.
MACD
– MACD line: -0.28
– Signal line: -0.15
– Histogram: -0.13
On H1, the MACD is negative and the line is below the signal.
Interpretation: intraday momentum is still pointed down, contradicting the tiny bullish crossover seen on the daily. That is a textbook sign of timeframe tension.
Bollinger Bands
– Mid band: $82.87
– Upper band: $84.36
– Lower band: $81.38
– Price: slightly below the mid band
Price trades a bit under the center of the hour bands.
Interpretation: the short-term move lower is controlled and grinding, not a sharp liquidation. The key range intraday is roughly $81.4–84.4.
ATR (14)
– ATR 14: ~$0.55
Hourly range around $0.55 gives you typical 0.6–0.7% bars.
Interpretation: intraday volatility is moderate. It is enough for scalpers, but it does not suggest a strong trend day.
Hourly pivot levels
– Pivot point (PP): $82.33
– First resistance (R1): $82.47
– First support (S1): $82.17
Again, price is sitting right on the pivot.
Interpretation: the market is pausing. A push above $82.5 or a break under $82.1 will likely determine the next short-term leg.
15-minute timeframe (M15) – execution context
The 15-minute chart is where you see the microstructure around $82.
Trend and EMAs
– Price: $82.32
– EMA 20: $82.20
– EMA 50: $82.47
– EMA 200: $82.61
– Regime tag: neutral
Price is slightly above the 20-EMA but still below the 50- and 200-EMAs.
Interpretation: very short-term buyers are trying to push off the lows, but they are still pushing against higher-timeframe resistance clusters between $82.5 and $83.
RSI (14)
– RSI 14: 52.7
RSI is marginally above 50.
Interpretation: micro momentum is tilting bullish, reflecting a small bounce off intraday support rather than a powerful trend move.
MACD
– MACD line: -0.02
– Signal line: -0.09
– Histogram: +0.07
MACD is still slightly below zero but has crossed above the signal on this timeframe.
Interpretation: the 15-minute chart is in bounce mode, supporting the idea of a short-term recovery attempt from the $82 area, even while higher timeframes remain cautious.
Bollinger Bands
– Mid band: $82.10
– Upper band: $82.41
– Lower band: $81.78
– Price: just under the upper band
Price hugging the upper band after crossing the mid line signals an intraday push higher.
Interpretation: very short-term, buyers are in control of the tape. However, they are running into a ceiling defined by the hourly EMAs above.
ATR (14)
– ATR 14: ~$0.20
Each 15-minute candle is swinging about $0.20.
Interpretation: micro volatility is stable. The tape is tradable but not chaotic.
15m pivot levels
– Pivot point (PP): $82.34
– First resistance (R1): $82.39
– First support (S1): $82.28
Price is again glued to the pivot.
Interpretation: the market is coiling at intraday fair value. An expansion away from this level will likely align with a break of the hourly pivots as well.
Cross-timeframe read: trend vs. bounce
Putting it all together:
- Daily (macro): Bearish structure, below all key EMAs, with mildly improving momentum (RSI near 46, tiny positive MACD histogram).
- Hourly (tactical): Neutral to slightly bearish momentum, price stalling under short EMAs, MACD negative.
- 15m (execution): Short-term bounce underway, with price riding the upper band and MACD crossing up.
There is a clear timeframe conflict: the very short-term tape is trying to bounce from $82, while the broader trend and hourly momentum still lean to the downside. In practice, these conflicts often resolve with either a failed bounce that rolls over, or a larger short-covering rally that finally pulls the hourly and then daily indicators into alignment on the upside.
Given the macro environment, with fearful sentiment, lower DeFi activity, and the reputational drag from the Drift hack, the burden of proof is on the more optimistic outcome. The path of least resistance, unless proven otherwise, remains further chop with a bearish tilt.
Bullish scenario for Solana price
For a constructive upside case, bulls need to turn this fragile bounce into something more structural. The current setup offers a clear map of what has to change.
What the bullish path looks like:
-
Hold the $80–82 support band
The current price sits right on the daily pivot around $82. A series of higher lows on the hourly chart above $81.5–82 would signal that dip buyers are present despite the fearful sentiment. -
Reclaim short-term EMAs
On H1, price must push and hold above the 20-EMA (around $82.7) and then the 50-EMA (roughly $82.5–83 as they adjust). On D1, a daily close above the 20-EMA near $83.7 and the Bollinger mid-band around $84 would be an important step toward neutralizing the downtrend. -
Momentum confirmation
Daily RSI should grind back above 50, daily MACD should expand its positive histogram and pull the MACD line toward zero, and hourly MACD needs to flip above zero and stay there for several sessions. -
Upside targets
If $82 holds and EMAs are reclaimed, the next logical reference is the upper daily Bollinger band near $91–92. Above that, the 50-day EMA in the high-80s to low-90s region becomes the key test for whether this is just a relief rally or the start of a more meaningful trend shift.
What invalidates the bullish scenario?
A decisive daily close below $80, ideally with price pushing toward or under the lower Bollinger band around $76.5, would be a first warning. Hourly structure breaking into a series of lower lows under $81, with RSI stuck below 40 and MACD expanding on the downside, would confirm that the bullish recovery idea is off the table for now.
Bearish scenario for Solana price
The bearish case builds directly on the existing daily trend and the risk-off environment. Sellers already have the structural edge and want to press it further.
What the bearish path looks like:
-
Failure at $83–85
The first line of defense for bears is to cap any bounce in the low- to mid-80s, especially near the daily 20-EMA and Bollinger mid-band around $84. If price repeatedly probes that area and fails, it signals distribution rather than accumulation. -
Intraday rollover from the pivot
On the 1-hour and 15-minute charts, watch for the current bounce to stall near the upper intraday Bollinger bands (around $82.4–82.8) with RSI unable to sustain above 50. A fresh turn lower from the hourly pivot around $82.3 accompanied by a weakening MACD histogram would be a classic continuation signal. -
Break of local support
A move below the hourly S1 region (around $82.1 and then $81.8–81.5) would open the path toward the daily S1 zone and lower band near $76.5–78. Daily RSI slipping toward 40 or below, and MACD widening to the downside again, would confirm that the current consolidation resolved lower. -
Downside targets
The obvious reference on the daily chart is the lower Bollinger band around $76.5. In a heavier selloff, you could see price extend somewhat below it before finding real demand, but the band is the first place to look for a reaction.
What invalidates the bearish scenario?
A strong daily close above $85, reclaiming the 20-day EMA and pressing convincingly through the Bollinger mid-band, would be the first sign. Hourly structure flipping into a clear pattern of higher highs and higher lows with RSI holding above 55 and MACD comfortably positive would further erode the short-term bearish thesis.
Positioning, risk, and uncertainty
This is not a clean inflection point; it is a hesitation zone inside a downtrend. Daily structure is still bearish, hourly momentum is soft, and only the 15-minute chart shows a constructive bounce. Combined with a macro backdrop of extreme fear, lower volumes, and negative headlines around Solana DeFi security, the balance of risk leans cautious.
For traders, the key questions right now are whether they are trying to fade the downtrend, betting on a bounce from $80–82, or looking to trade with the trend, waiting to sell failed rallies into $83–85. Given ATR levels of about $4 on D1, any sizing and risk management must handle 5% daily swings without forcing exits at the worst possible moment.
Clarity should improve once price either loses $80 convincingly or reclaims and holds above $84–85. Until then, expect choppy action around the pivot, with a slight downside bias driven by the broader risk-off environment and still-bearish daily structure.
In summary, this is a time to respect volatility, define invalidation levels tightly, and accept that both upside and downside scenarios carry meaningful uncertainty from here for anyone tracking the Solana price.