Cardano could rally from its current price to unprecedented levels, with two major price indicators supporting this potential move.
Over the past 24 hours, Cardano ($ADA) has increased 7.15%, the second-best performance in the top 15 crypto ranking by market cap. While it has joined a broader market resurgence that saw Bitcoin reclaim $71,000, an analysis of its higher-timeframe chart points to further price expansion.
Key Points
- Cardano shows several reversal signals on its weekly chart, all pointing to a rally to much higher prices.
- The first identified catalyst for this move is a classic higher-timeframe double bottom.
- The second reversal signal is the imminent breakout from a falling wedge.
- A breakout would target a potential 1,801% rally to a new all-time high of $5.
Cardano Reversal Signals
An analysis from “GoTX” has highlighted reversal signals on Cardano’s weekly chart, all pointing to a rally to much higher prices. He suggested that a new cycle is in the works for the prominent altcoin, with its price action shifting from distribution to expansion.
Notably, the first identified catalyst for this move is a classic higher-timeframe double bottom. The accompanying chart shows that $ADA has found support in the same demand zone, indicating that bears can’t breach key price levels despite their dominance.
These two bottoms are three years apart, further strengthening the conviction that it would be massive for the cryptocurrency’s price. The first happened in June 2023 when Cardano was still grinding downwards after its 2021 peak of $3.10. Its price dropped to $0.2200 in early June 2023, which marked its lowest price that cycle.
Second Bottom Formation
After recovering considerably from there to March 2024’s high of $0.810 and further to December 2024’s high and this cycle’s peak price of $1.320, bears stepped in again. The high of $1.020 in August 2025 turned out to be a lower high, with Cardano slowly but consistently dropping to lower levels.
In February, $ADA finally retested the previous cycle’s bear market lows, dropping to $0.2205. This was almost the exact price it reached in June 2023. As seen earlier, the coin also bounced from this low and currently trades at $0.262, approximately 19% above the local support area.
The analysis views this as a double-bottom formation, one of the catalysts for a new bullish cycle in which $ADA starts to recover considerably.
Cardano Wedge Breakout Targets $5
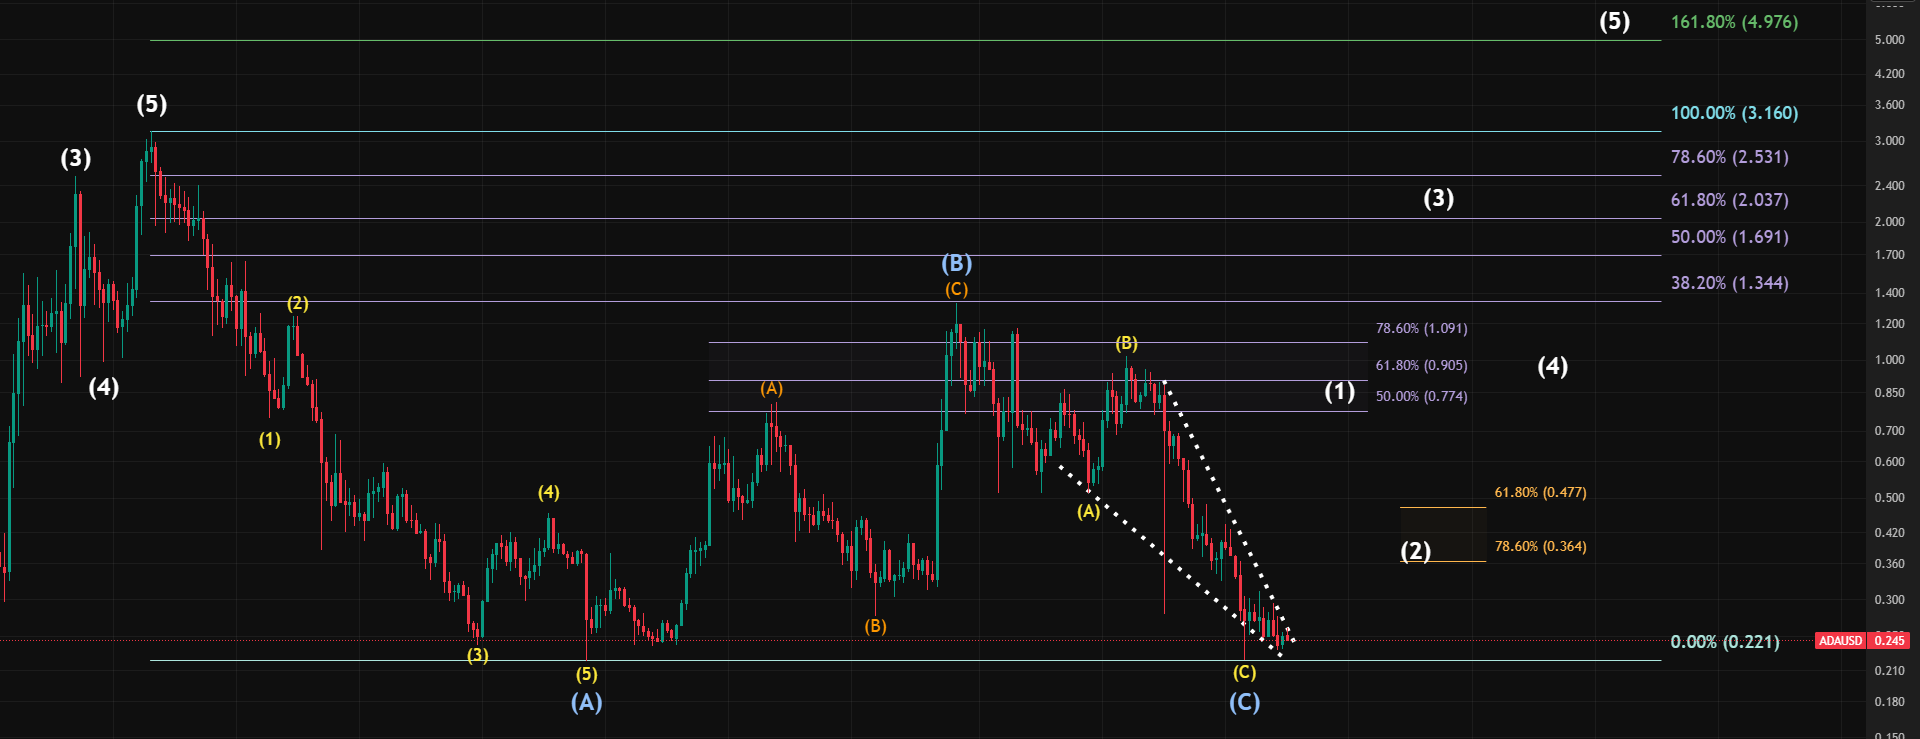
Meanwhile, the second reversal signal is the imminent breakout from a falling wedge. Notably, this pattern has been forming since June 2025, with prices making a lower high and a lower low within it.
The first move was a wave (B) relief rally, taking Cardano from $0.510 to the August 2025 high of $1.020. It followed a corrective wave (A), which dragged the coin from $1.320 in December 2024 to the point where the falling wedge began forming.
Afterward, another wave of correction pushed $ADA to the second bottom at $0.2205, completing wave (C). $ADA has continued to trade within this falling wedge but is nearing a breakout. Its 4.7% rise this week brings it close to the wedge’s neckline resistance.
A breakout would have a substantial impact on Cardano, with the analyst targeting a rally to $5. The potential 1,801% surge from the current price of $0.263 to the new all-time high would take it to the 1.618 Fibonacci extension.
Before this target are key levels at $3.160 and $2.037, aligning with the 100% and 61.8% Fibonacci levels.