
On April 7, Zcash ($ZEC) price once again spiked by 5% on the daily chart, riding the wave of the crypto market’s downfall.
At the time of writing this, the leading privacy coin is hovering around $269.66 with a spike of 5.13%, with a market capitalization of $4.48 billion, according to CoinMarketCap. The daily trading volume currently revolves around $459.31 million.
Zcash ($ZEC) Breaks the Descending Trendline
Zcash is showing signs of a potential two-level breakout in the current market. The price is now pushing into the red supply zone around $270 after finally breaking above the descending trendline that has been capping rallies since January.
A strong close above this area would confirm a double breakout, clearing both horizontal resistance and the trendline, which makes this level especially important for traders watching the chart.
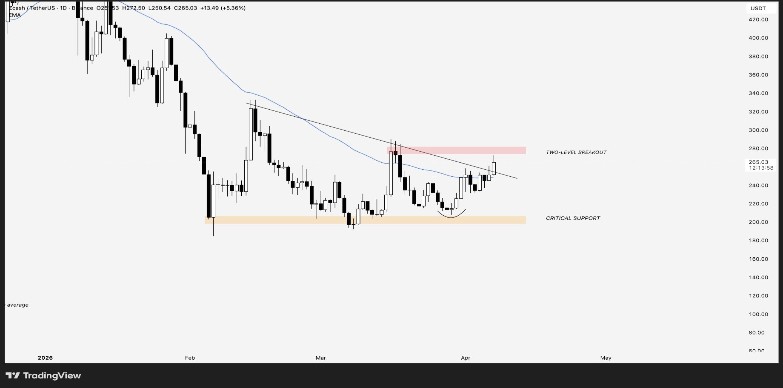
(Source: CoinMarketCap Community)
On top of that, the price is back above the daily 50 EMA shown in the blue for the first time since losing it near $460. That makes the first real sign of momentum and confluence this chart has shown in a while. If this breakout holds, a move toward $300 could be the next target.
While the majority of the crypto sector is facing a consolidation zone, Zcash did not wait for any confirmation and simply moved higher on its own. The breakout has already played out clearly with a strong push from support levels and a clean bullish structure that continues to hold.
The chart is showing higher lows forming along with steady momentum. It means that buyers are in full control at this moment. If the price keeps holding above the middle zone, more upside remains open for the coming days. The current direction is clearly bullish.
For traders looking to enter positions, the suggested entry zone sits between $260 and $268, but only on dips. The stop loss should be placed at $238 to manage risk. The price targets are set at three levels, with the first taking profit at $282, the second at $295, and the third at $310.
According to TradingView, the Relative Strength Index on the daily chart is revolving around 63, which points to healthy buying pressure without entering overbought territory. The Moving Average Convergence Divergence is giving a positive signal as the histogram expands and the lines cross upward. Most major moving averages, including the 50-day and 200-day simple moving averages, now sit below the currency price, which confirms an upward trend.
There is immediate support at around $249 and resistance around $290 based on recent important levels. The price has broken above a multi-month descending trendline, which often precedes further gains. Bollinger Bands have begun to widen, which suggests sustained volatility that could support additional upside if volume remains elevated.
Macroeconomic conditions have also supported the selective strength in privacy coins like Zcash. The broader cryptocurrency market, including Bitcoin, has shown mixed performance, with many assets trading flat or slightly lower amid ongoing uncertainty around global interest rates and geopolitical developments.