$XRP Stabilizes Above Key Support: A Launchpad for $1.45?
The cryptocurrency market in April 2026 is witnessing a pivotal moment for $XRP. After a period of cooling off from earlier yearly highs, the $XRP/USD pair has established a formidable defensive line. As of April 7, 2026, technical charts reveal that the $1.30 level is acting as a "line in the sand" for bulls, preventing further downside and setting the stage for a potential trend reversal.
Where is $XRP Heading?
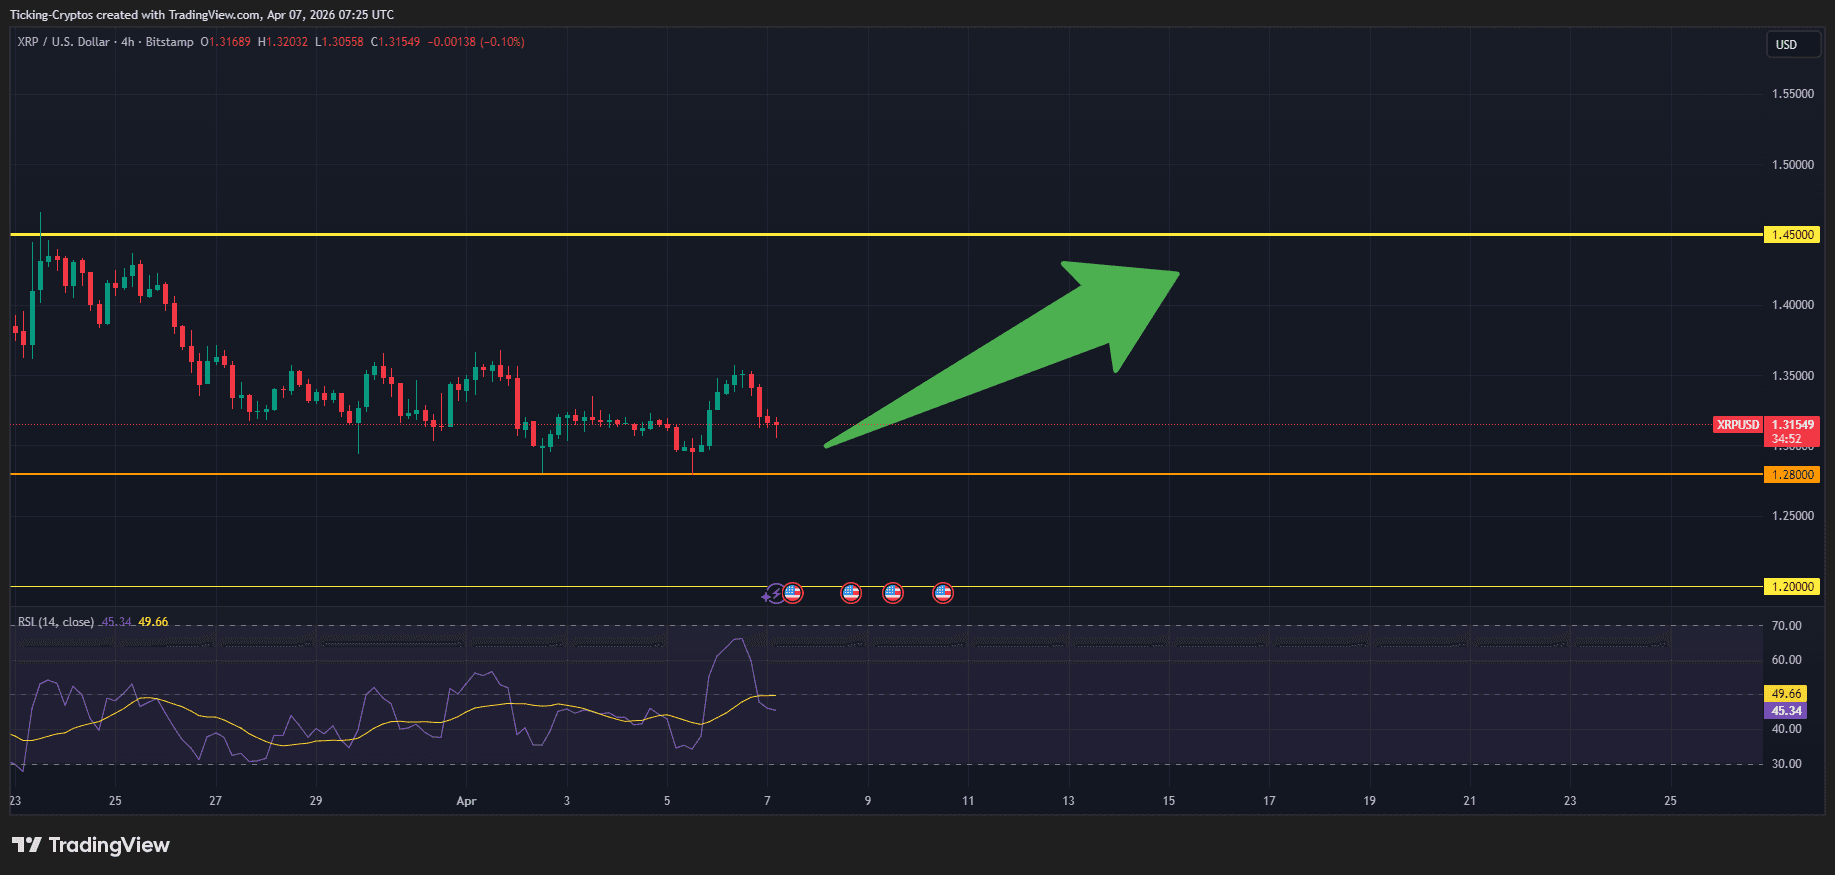
Currently, $XRP is trading near $1.315, hovering just above its primary support zone. If the current consolidation phase completes with a bullish breakout, the immediate target is $1.45. Conversely, a failure to hold the $1.28–$1.30 range could see a retracement toward $1.20.
$XRP Price Analysis: The $1.30 Support Zone
The recent price action on the 4-hour chart illustrates a clear "floor" forming at the $1.28 - $1.30 horizontal support level (marked by the orange line). Despite multiple tests over the last week, sellers have been unable to push the price decisively below this mark.
Key Technical Indicators:
- Relative Strength Index (RSI): The 14-period RSI is currently sitting at 45.34, which is neutral to slightly oversold. This suggests that the bearish momentum is exhausting, and there is ample "headroom" for a price surge without hitting overbought territory immediately.
- Price Structure: We are seeing a series of "higher lows" starting to form on the shorter timeframes, a classic signal of accumulation.
- Moving Averages: $XRP is currently battling to stay above its 100-hour Simple Moving Average (SMA), a successful flip of which would confirm the short-term bullish bias.
Bullish vs. Bearish Targets for April 2026
The market is currently in a state of "compressed volatility." This usually precedes a sharp move in either direction. Based on current market structure, here are the levels to watch:
The Bull Case: Target $1.45
If $XRP maintains its position above $1.30, the first major hurdle is the $1.35 resistance. A breakout above this level, backed by increasing volume, would likely trigger a fast move toward the $1.45 yellow resistance line shown on the chart. This represents a potential 10% gain from current levels.
The Bear Case: Target $1.20
Should the broader market—led by Bitcoin—face a sudden downturn, $XRP might lose its $1.28 footing. In this scenario, the next structural support lies at the psychological $1.20 level. Traders should keep a close eye on crypto exchanges to ensure they have the best liquidity for tight stop-loss management.
Ripple’s $13 Trillion Play
Beyond the charts, the fundamental backdrop for Ripple remains robust. Recent reports indicate that Ripple’s integration with SWIFT-certified infrastructure—following its major 2025 acquisitions—is now processing significant annual flows. This "utility-driven" valuation is a major reason why $XRP is holding higher support levels compared to previous cycles.
Furthermore, with the SEC–CFTC Memorandum of Understanding providing clearer regulatory lanes in 2026, institutional "smart money" appears more comfortable accumulating $XRP during these consolidation phases.
The current price action represents a classic "wait and see" period. The tight range between $1.28 and $1.35 is where the next major trend will be decided.