
The $SOL price fell back below the $80 level after briefly pushing above that mark, reinforcing pressure on a support zone between $78 and $75. At press time, the token traded near $79.94, down 2.51% over 24 hours, 4% over seven days, and 22% year over year. The move placed traders’ attention back on a range that has repeatedly absorbed selling pressure since early February.
That latest rejection also kept $SOL below the 0.236 Fibonacci retracement level at $86.70, showing that buyers have not restored short-term control. The retreat followed a sharper sell-off on April 1, when the token dropped more than 11% from $86.63 to $76.69. That decline pushed the asset directly into the same support band that has defined recent downside trading.
Support Zone Returns to Center Stage
Market data in the provided figures below showed that the $78 to $75 area has remained the most important defensive zone for $SOL in recent months. Since early February, each rebound from that region has ranged between 19% and 24%. That record has made the band a closely watched level during each fresh bout of weakness.
This time, however, the tone around the $SOL price remained soft after the market failed to hold gains above $80. The rejection left the token under a psychological threshold and below a key Fibonacci marker. Together, those signals reflected a market where sellers still controlled the near-term structure.
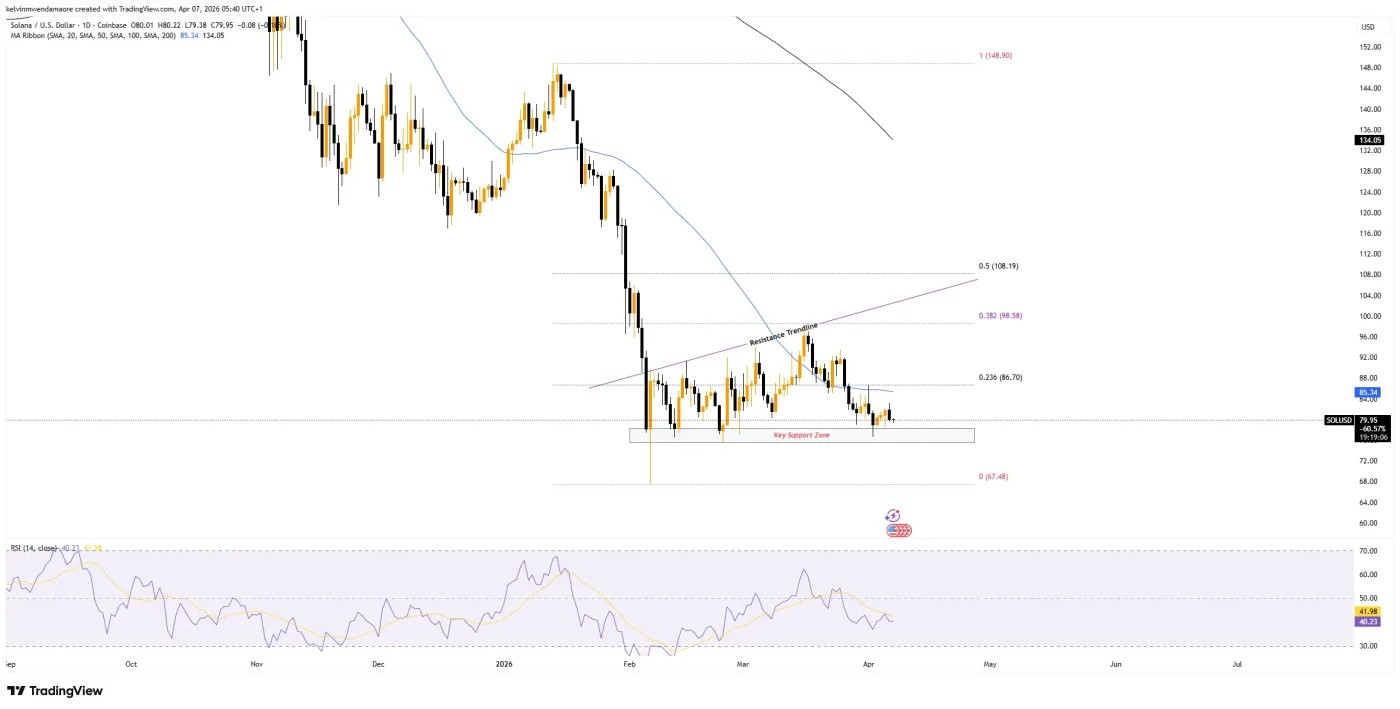
$SOL 1-Day Price Chart (Source: TradingView)
Further pressure appeared in the trend indicators. $SOL traded below its 50-day simple moving average at $85.34 and well under its 200-day moving average at $134.05. That gap highlighted the scale of the recovery needed before the broader trend could show measurable improvement.
Momentum readings also remained weak. The relative strength index hovered near 40, below the neutral 50 level. That reading showed bearish momentum remained in place, even without the token reaching a deeply oversold condition.
Exploit Shock and Capital Flight Deepen Weakness
Based on reports, the initial bearish trigger in the current sequence began on April 1. On that day, the $SOL cryptocurrency dropped sharply after a reported $285 million exploit on the Solana DeFi protocol Drift. The incident was described as a sophisticated attack that had unfolded over several months.
https://t.co/qYBMCup9i6
— Drift (@DriftProtocol) April 5, 2026
That breach damaged short-term trust in the ecosystem’s security and prompted capital withdrawal. That pressure also appeared in on-chain figures cited from DefiLlama. Solana’s total value locked reportedly fell from around this year’s $9 billion high to about $5.5 billion, at press time.
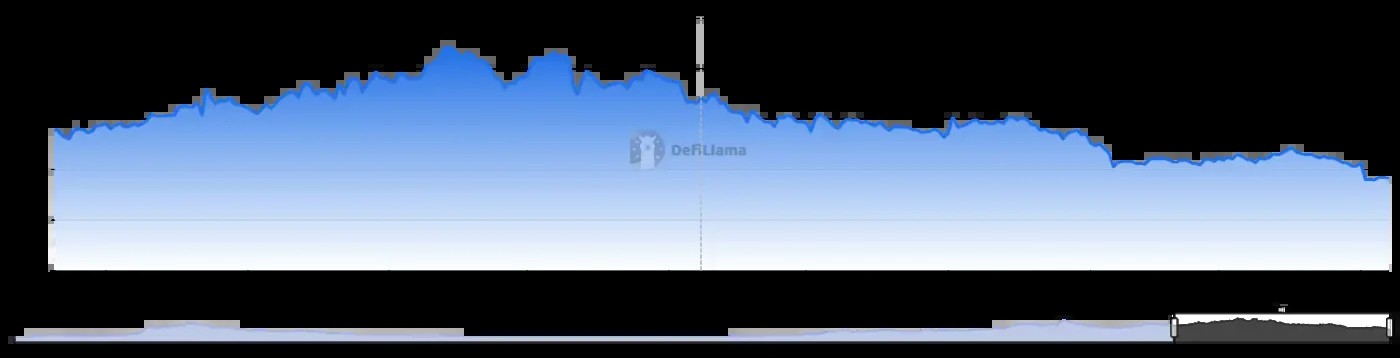
Solana Total Value Locked Metric (Source: DefiLlama)
At the same time, 1.40 million $SOL, valued at roughly $110 million, moved to exchanges in three days. The combined picture pointed to shrinking network demand and a visible shift toward potential sell-side activity. In the supplied interpretation, the trend remained bearish.
Trading activity also picked up as prices weakened. The $SOL price recorded a 24-hour volume increase of 5.91%, reaching $3.19 billion. That rise in turnover, alongside a falling price, showed that traders were actively responding to the latest decline.
Sentiment indicators also reflected caution. The Fear & Greed Index stood at 36, a level that signaled lingering market unease. The outlook remained tied to whether broader market strength could continue to support the token.
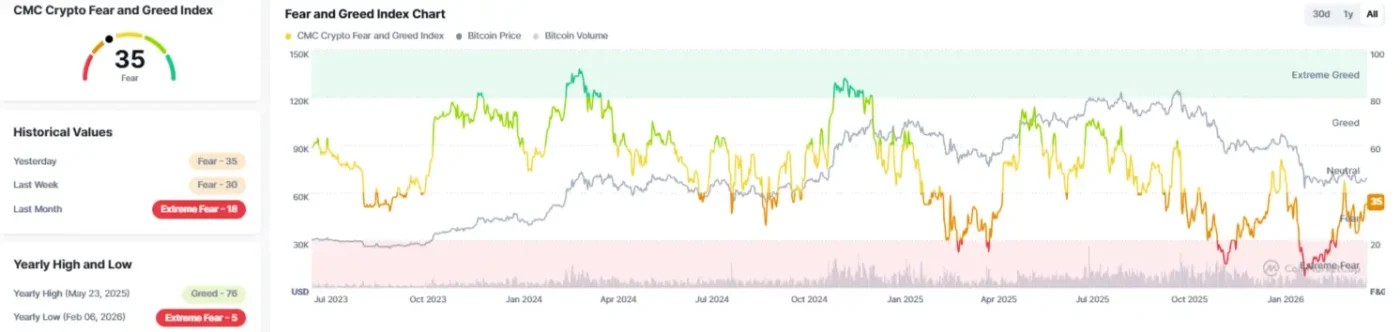
Crypto Market Fear and Greed Index (Source: CoinMarketCap)
For now, however, Solana remained under pressure. A daily close below $78 could open the door to further selling toward $75, while a move back above $82 would offer the first sign of stabilization.
Also Read: XRP Price Drops 2% as Weak Sentiment Keeps $1 Target in Focus