
$XRP is currently at risk of recording seven consecutive monthly losing candles for the first time since the 2013/2014 cycle.
The broader crypto market remains in a multi-month downtrend, and $XRP has been one of the biggest losers, down 63.6% from its July 2025 peak. Amid the selling pressure, $XRP is now on track to see a seventh consecutive monthly loss unless April turns the tide around.
Key Points
- $XRP has declined 63.6% from its July 2025 peak of $3.6 and 28.4% since the start of this year.
- The ongoing downturn has led to six consecutive monthly losing candlesticks since October 2025, with $XRP on track to record a seventh one.
- The last time $XRP saw such an extensive losing streak was in the 2013/2014 cycle.
- Historical data shows that a 900% rebound ensued shortly after the 2014 trend, as $XRP became incredibly undervalued.
- The $XRP monthly RSI has now dropped to its lowest since the 2022 FTX collapse.
$XRP Sees Six Consecutive Monthly Losses
For context, the ongoing market-wide turbulence began in October 2025 in the aftermath of the 10/10 market crash that led to record liquidations across the board. Bitcoin ($BTC) and the rest of the crypto market suffered the heat, but $XRP saw some of the steepest losses.
This trend has persisted until now, with $XRP consistently seeing lower highs and lower lows since October 2025. While the market recorded five consecutive monthly losses, $BTC and a few other tokens broke this losing streak in March 2026, when they recorded their first monthly gain of the year.
$XRP was one of the unlucky tokens that sustained the bearish trend, seeing declines in March and maintaining a streak of six consecutive monthly losses. Interestingly, $XRP had not witnessed such an extensive losing streak for over a decade, as even the Terra and FTX implosions of 2022 triggered only three consecutive monthly losses each.
At Risk of a Seventh Monthly Loss
While $XRP began April on a good note, the bullish momentum quickly faded on the first day of the month. So far, the token has recorded declines this month, down 1.8% at press time. This puts $XRP at risk of its seventh consecutive monthly loss unless things turn around for good in April.
The last time $XRP saw this extensive losing streak was during the 2013/2014 cycle, when it recorded red candlesticks from December 2013 to June 2014. Within this stretch, $XRP saw a whopping 90% loss in value, crashing from $0.0383 to $0.0038 by the time the downtrend ended.
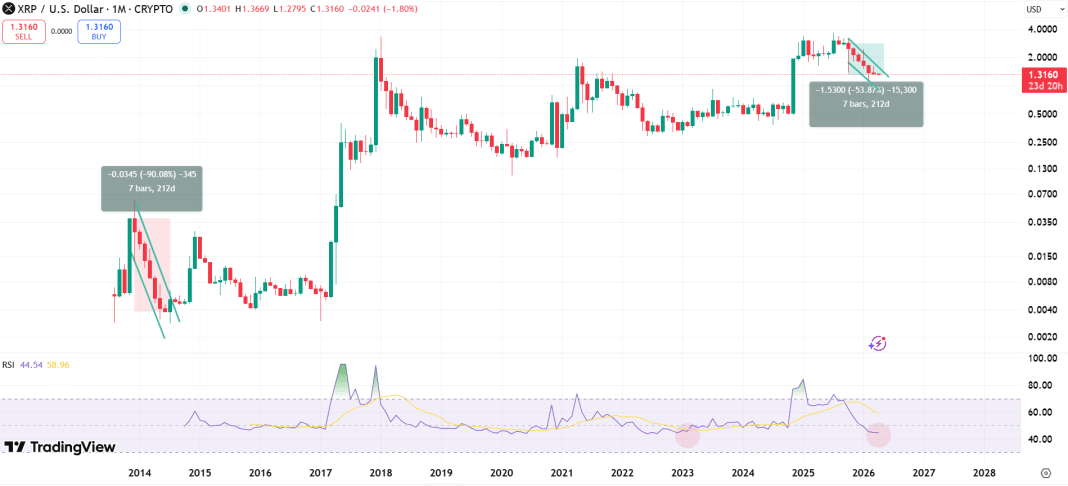
What followed was an impressive rebound push, as the persistent selling pressure resulted in steep undervaluation. Specifically, $XRP soared from a low of $0.0028 in July 2014 to a high of $0.0280 by December 2014. This marked a 900% increase within five months.
$XRP RSI Now at Its Lowest Since the FTX Implosion
Interestingly, chart data confirms that $XRP may be experiencing similar levels of undervaluation amid the current downtrend. Notably, the monthly RSI has dropped to 44.54 at press time, from a high of 73.08 in July 2025.
The last time the $XRP monthly RSI recorded such low readings was in December 2022 after the FTX implosion. At the time, the price stood at $0.40. Experiencing similar lows at current prices of $1.31 confirms $XRP’s growth since then. If the price witnessed a loss in April and recorded only half of the 2014 surge, it could reach a new peak of $7.2.