
Siren AI is a protocol that has captured the crypto community’s attention for its plan to bring intelligent, autonomous analysis directly onto the blockchain. After a period of explosive growth, the Siren price shows signs of stabilizing after a brutal 67% weekly drawdown.
The markets currently remain in unrest due to the shifting global macroeconomic signals and a general “risk-off” environment, the AI-agent sector is undergoing increased adoption. Traders are now monitoring the $0.53 zone on $SIREN’s chart, looking for any sign that the analytical “Golden Siren” can reclaim control from the current bearish momentum.
The Dual-Persona AI Analyst on $BNB Smart Chain
Siren is a fully on-chain AI analyst agent operating primarily on the $BNB Smart Chain. The project is built around a “dual-persona” architecture designed to provide traders with different perspectives on market action.
The “Golden Siren” acts as the measured, analytical persona focused on long-term data and fundamental shifts, while the “Crimson Siren” represents a more aggressive, momentum-driven approach to trading. By embedding these AI agents directly into the workflow of decentralized finance (DeFi), the project aims to bridge the gap between complex on-chain data and actionable retail strategies.
Siren’s unique value proposition recently pushed the project’s market capitalization to $401.38 million. However, as the initial hype surrounding AI-driven decentralized exchanges (DEXs) cools off, the token ticker is facing a critical test of its long-term viability. With $84.51 million in 24-hour trading volume, there is still plenty of liquidity moving through the system.
Siren Price Chart Shows Bearish Signs
The 15-minute Siren price chart shows a massive vertical impulse earlier in the month that accounts for the remaining 39.2% monthly gain before the price hit a major wall. The visual data shows a series of aggressive “staircase” drops, with the most recent slide pushing the valuation toward its current $0.53491 level.
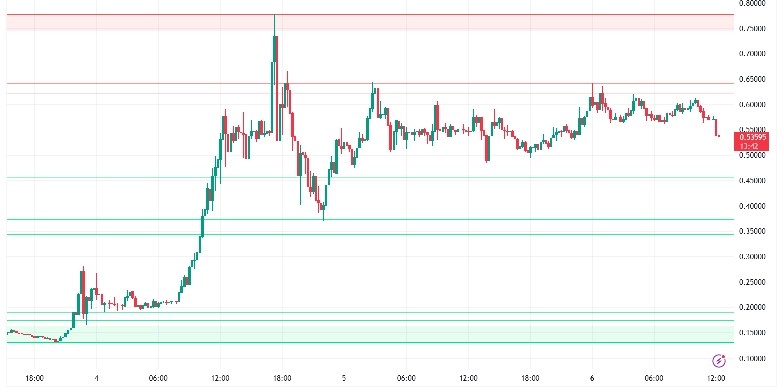
The chart highlights a consolidation range between $0.52 and $0.58. Every time the bulls try to mount a recovery toward the $0.60 psychological barrier, they are met with a heavy “pink zone” of supply that has previously acted as a rejection point.
For a genuine recovery to take place, the asset needs to break out of this choppy range and flip the $0.60 level back into a support floor. Until then, the price remains trapped in a defensive posture, relying on the green horizontal support bands near $0.50 to hold back a deeper slide.
Technical indicators suggest that the selling pressure might finally be coming to an end, though a reversal is not yet confirmed. The Relative Strength Index (RSI) on the 15-minute timeframe is currently hovering around 46. The RSI is in a neutral level, indicating that the asset has moved out of the “oversold” zone but hasn’t yet found the buying volume needed to turn bullish.
The MACD (Moving Average Convergence Divergence) is showing signs of a slow build-up. The histogram is printing minimal bars, and the signal lines are beginning to converge near the zero baseline. If the MACD can execute a clean bullish crossover while the volume picks up, it would provide the first major signal for the “Stakeholders” to re-enter.
If $SIREN can successfully defend the current floor and break above the $0.60 resistance, our price prediction suggests we’re likely looking at a relief rally toward the $0.75 – $0.80 range. On the other hand, if the green support floor at $0.52 fails to hold, the price is likely to slide toward the $0.40 liquidity zone.