$XRP remained pinned near $1.30 at press time after falling almost 2% over the past 24 hours, extending a broader slide already visible across longer time frames. That left the asset near a familiar support shelf rather than inside a fresh collapse. Meanwhile, the token is down 4.53% over the past month and 38.69% year over year, showing that recent weakness sits inside a much larger decline.
That drop returned the market to a narrow $1.31 to $1.27 support zone that has repeatedly slowed downside pressure since mid-February. The zone followed a sharp mid-March slide that cut $XRP’s price by about 20% and reset the market back to a repeatedly tested floor.
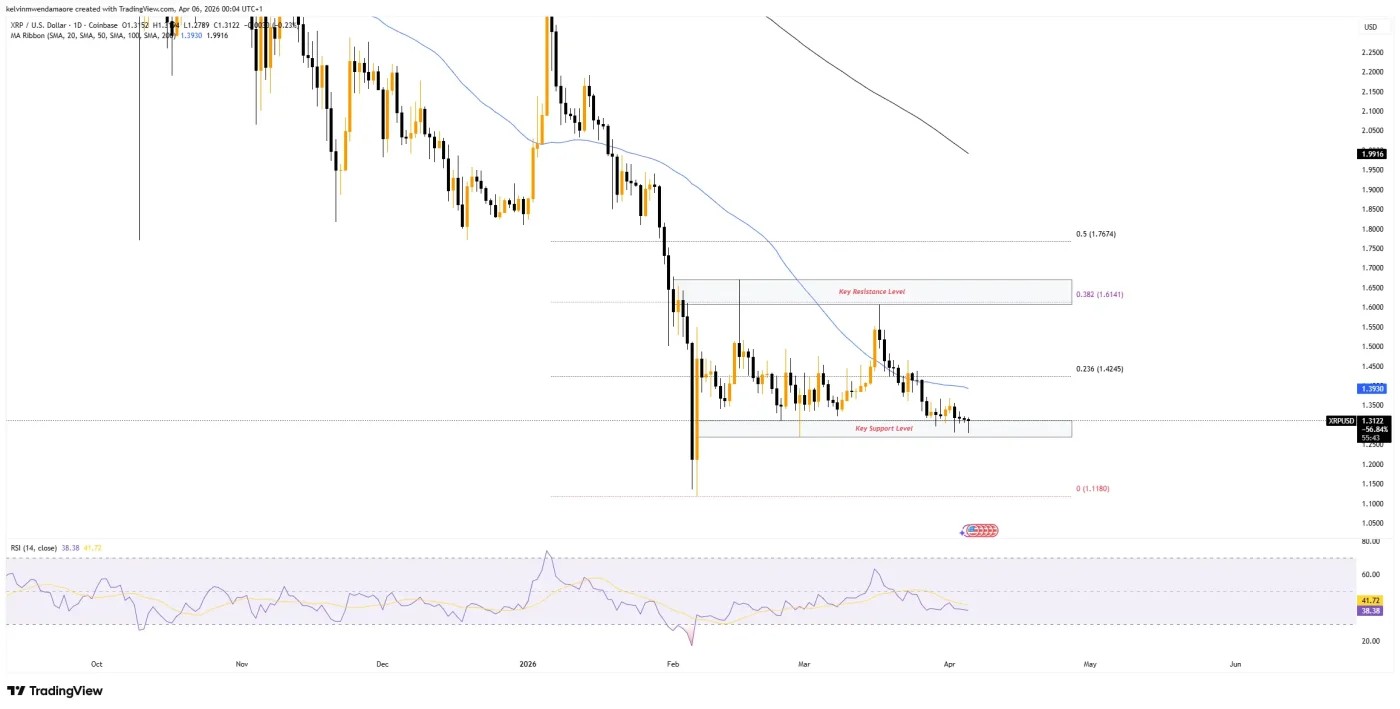
$XRP 1-Day Price Chart (Source: TradingView)
Earlier tests of this floor produced rebounds of roughly 24% to 26%, but the present response has stayed noticeably weaker. Participation has also remained well below the periods when those earlier swings developed, leaving the support reaction statistically less convincing.
Market Mood Turns Defensive
Notably, a broader risk-off shift across crypto added to the weakness. The CMC Altcoin Season Index dropped 10.53% in 24 hours, falling from 38 to 34. That reading showed capital moving away from higher-risk altcoins and toward Bitcoin, which rose 1.18%, or toward cash during a more defensive stretch.
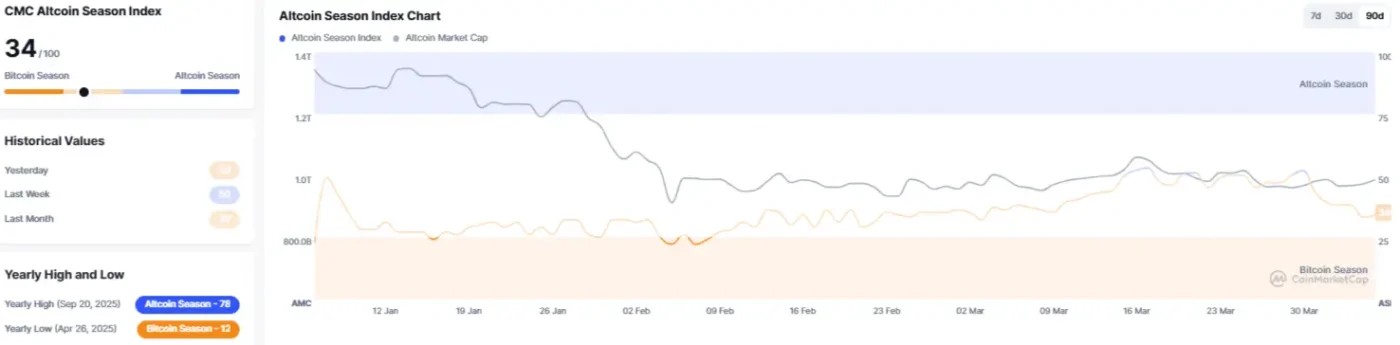
Crypto Market Altcoin Season Index (Source: CoinMarketCap)
As a major altcoin, $XRP underperformed while the market’s largest asset traded slightly higher, reinforcing that the latest pressure was tied to broader sentiment. The weakness, therefore, reflected market positioning rather than a fresh asset-specific catalyst.
Breakdown Below Moving Averages
Technical readings also weakened. The $XRP token traded below its 50-day and 200-day simple moving averages, listed at $1.39 and $1.99, respectively. Similarly, the daily RSI stood at 38.8, a level associated with oversold conditions in the data. At the same time, 24-hour trading volume jumped 46.57% to $1.31 billion, indicating that the move lower came with stronger participation.
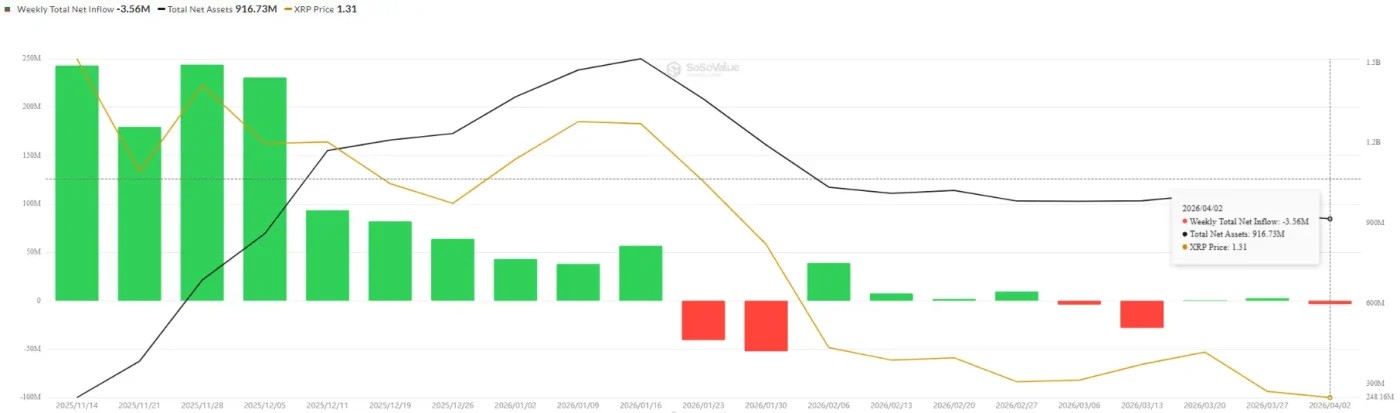
$XRP ETFs Outflow (Source: SoSoValue)
The 24-hour decline of almost 2% also arrived while the token held near the lower edge of its recent range. Institutional demand remained weak as $XRP ETFs posted a net weekly outflow of $3.56 million. Taken together, the moving-average break, heavier turnover, and ETF withdrawals aligned with the same downward trend.
Resistance Overhead Remains Crowded
TradingView data placed the asset below a dense resistance cluster formed by the $1.67 to $1.60 supply zone and the 23.60% Fibonacci level at $1.42. That area also includes the 200-week moving average and the 50-day moving average, creating several barriers inside the same upper range.
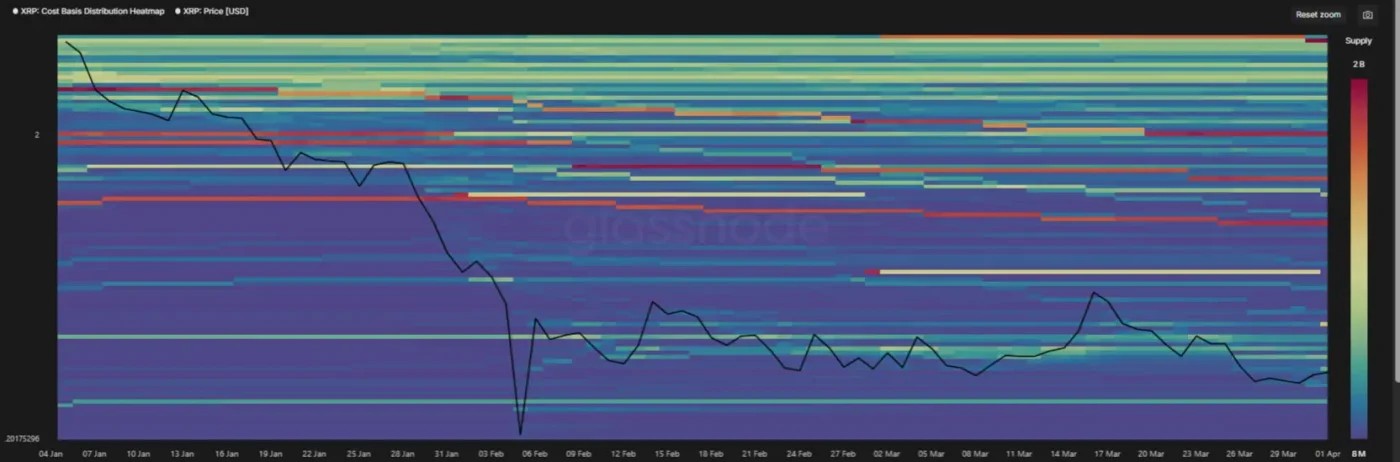
$XRP Cost Basis Distribution Heatmap (Source: Glassnode)
A cost-basis distribution heatmap showed that investors bought more than 1.1 billion tokens inside that band. That concentration matters as it identifies a zone where trapped holders sit near their entry levels after the March decline. The March sell-off started from that overhead zone, making it both a historical rejection point and a present technical ceiling.
Why $1 Stays in Focus
The price is now retesting the upper boundary of support at $1.31, the same level that has helped contain downside moves for weeks. The data defines a break below that level as a continuation of the current downtrend. The next level cited is this year’s low near $1.11, followed by the psychological measured target at $1.
With $XRP price near $1.30, the market sits between an established floor and a crowded ceiling, while the broader altcoin backdrop stays weak. That sequence answers the central question in the setup: bearish sentiment has deepened, support remains active, and $1 stays on the chart as a defined target.
Also Read: Dogecoin Stalls at $0.09 as Whales Buy 500M DOGE: Breakout Ahead?