Nonetheless, the wider backdrop remained cautious. Market sentiment stayed in “Fear” territory, with the Fear & Greed Index at 30. Within that setting, the token’s upward move appeared more like a response to general market drift than a standalone re-rating.
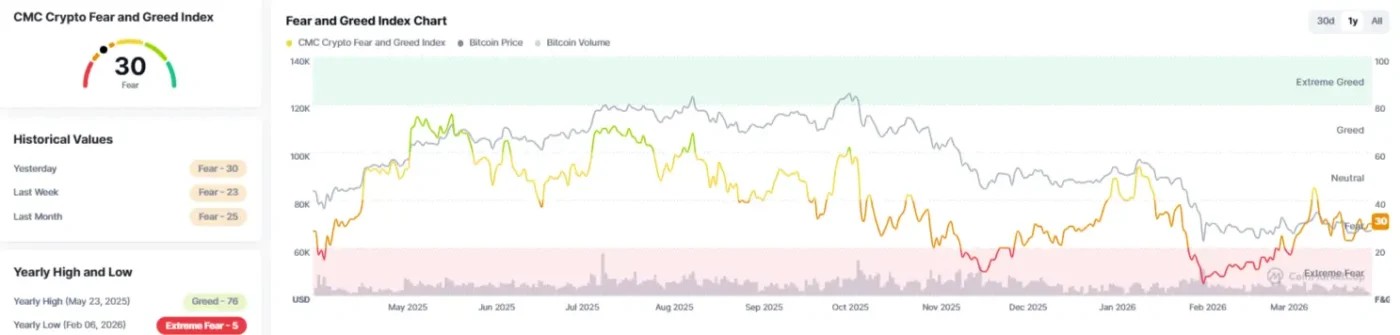
Crypto Market Fear and Greed Index (Source: CoinMarketCap)
That distinction mattered as no secondary driver appeared in the supplied data. There was no notable derivatives surge, no sector rotation signal, and no ecosystem-specific development cited to explain stronger demand. In simple terms, the rally lacked a fresh catalyst beyond a modest market bounce.
Price Structure Shows Strength, but Also Friction
Chart data reinforced that balanced picture. Market analyst Altcoin Sherpa described being “pretty conflicted” on the token, citing recent selling pressure and a lack of a clean setup for fresh entries. He also noted that large sellers had affected recent trading.
The chart placed $HYPE near $35.8 in the four-hour timeframe after a sharp retreat from the March high of around $43.8. Since that peak, $HYPE’s price had drifted into a lower range and hovered close to the 0.5 Fibonacci retracement near $34.7.
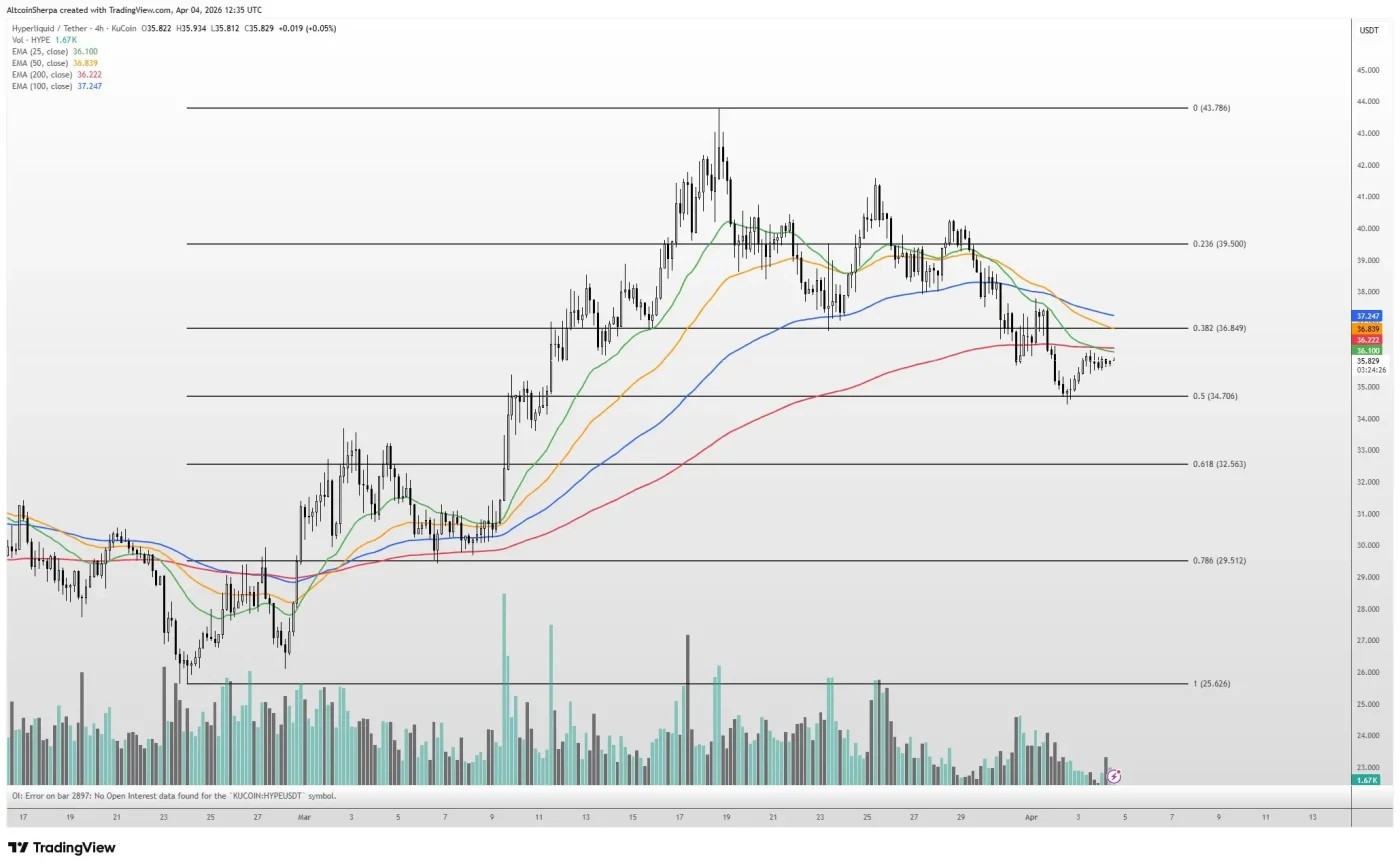
$HYPE 4-Hour Price Chart (Source: Altcoin Sherpa’s X Post)
At the same time, the token struggled to reclaim a cluster of overhead moving averages between roughly $36.1 and $37.2. That positioning showed a market caught between support below and resistance above. The structure, however, did not erase the larger uptrend, but it showed cooling momentum after a fast earlier run.
Its seven-day performance added another layer to that caution. Despite the recent daily gain, the $HYPE token remained down 7.62% over the week. That decline suggested overhead supply was still present, even as the broader yearly trend remained positive.
Why Traders Are Debating Valuation
The debate over whether $HYPE is overpriced came from that contrast between long-term returns and short-term confirmation. On one side stood the 205% year-on-year gain and its place among the year’s better-performing altcoins. On the other hand stood weaker volume, recent selling pressure, and a market still searching for conviction.
The data showed that price had advanced but not in expanding participation. Volume dropped nearly 40% to $99.09M, and the move was described as a low-volume drift rather than a catalyst-driven trend shift. That made valuation questions harder to settle through price alone.
What the Market Is Watching Next
Meanwhile, the near-term outlook in the supplied data remained tied to broader market stability. Bitcoin holding above $67,000 was identified as a key condition. For the token itself, holding above $34 kept the possibility of a retest of the $38 to $40 resistance zone in play.
A stronger signal would require more than price stability. The data pointed to a decisive break and close above $40, supported by rising volume, as the key test for stronger bullish momentum. Until then, the numbers showed a token still advancing on the year but facing a more skeptical market at current levels.
Also Read: Chainlink Consolidates at Key Support for 9 Weeks as LINK Eyes Breakout

 cryptonewsz.com