Solana ($SOL) continues to trade within a tight range after a prolonged decline, as broader market conditions reinforce cautious sentiment among traders. The asset currently sits near a critical support area, where buyers and sellers appear to balance each other.
This consolidation phase follows months of lower highs and lower lows, which still defines the dominant market structure. However, recent price action shows a slowdown in momentum, suggesting that the market may be preparing for its next move. Consequently, traders now watch key levels closely to confirm either a breakout or a deeper correction.
Market Structure Signals Weak Momentum
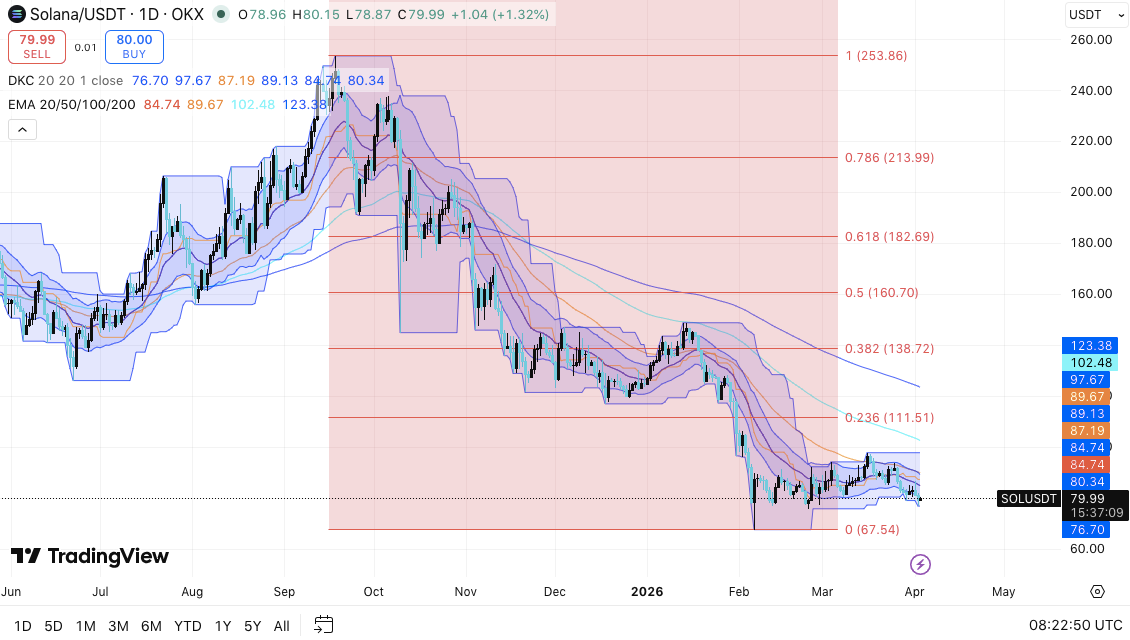
Solana maintains a bearish structure, with price trading below major moving averages such as the 50, 100, and 200 EMAs. This alignment confirms that sellers still control the broader trend. Additionally, the formation of lower highs shows that each recovery attempt weakens over time.
Moreover, the current sideways movement reflects a consolidation phase after a sharp selloff. This type of structure often appears when the market absorbs previous selling pressure.
Hence, the price remains trapped between defined support and resistance levels. Volume patterns also suggest hesitation, as neither buyers nor sellers show clear dominance.
Related: Cartesi Price Prediction: CTSI Surges 65% — Can Bulls Break $0.045?
The Donchian channel compression indicates reduced volatility. Consequently, this setup often precedes a breakout in either direction. However, the current positioning below resistance suggests that sellers maintain a slight advantage.
Key Levels Define Short-Term Direction
Support holds near the $79 to $80 zone, where price currently trades. This level aligns with recent pivot areas and has attracted repeated buying interest. Additionally, a stronger support zone exists between $75 and $77, where price has bounced multiple times.
If price loses this region, downside pressure may increase. In that case, the $67 to $70 range becomes the next critical area. This zone marks a previous swing low and may act as a liquidity target.
On the upside, resistance appears near $85 to $89, where price has faced repeated rejection. Furthermore, the $91 to $95 zone represents a stronger barrier, supported by moving averages and historical structure. A breakout above this area may shift momentum toward $100 and beyond.
Market Behavior Suggests Accumulation Phase
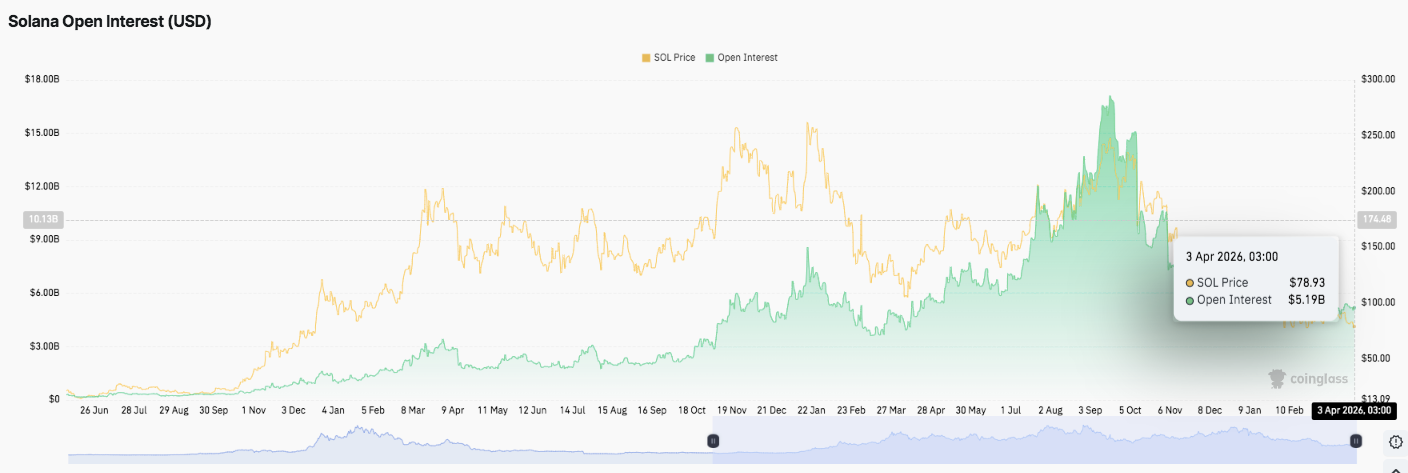
Open interest trends show long-term growth with cyclical pullbacks. This pattern reflects rising participation during upward phases, followed by unwinding during declines. Significantly, recent stabilization suggests reduced leverage and more cautious positioning among traders.
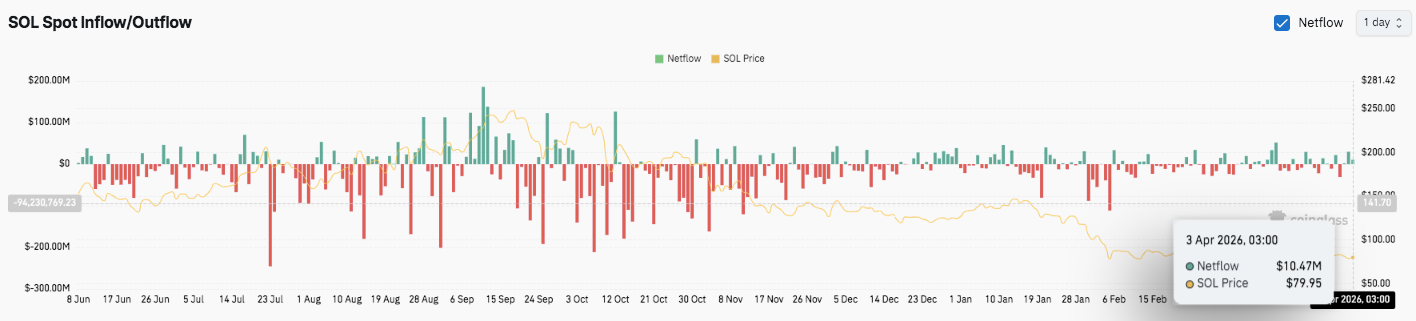
Spot inflows and outflows also reveal shifting sentiment. Earlier periods show balance, while later data shows stronger outflows. This shift aligns with declining prices and increased selling pressure. However, recent stabilization indicates that the market may now enter a quieter phase.
Technical Outlook for Solana ($SOL)
Key levels remain well-defined as Solana trades inside a tightening range, reflecting ongoing consolidation after a broader downtrend.
Upside levels: $85, $89, and $91 act as immediate resistance hurdles. A breakout above this zone could extend toward $95 and $100, where stronger resistance sits. Moreover, a decisive move beyond $100 may open the path toward $110, signaling a potential shift in medium-term structure.
Downside levels: $79 serves as the immediate support, followed by $77 and $75 as the next key cushions. A breakdown below this cluster may expose $70 and $67, which represent the last major swing lows and a critical liquidity zone.
Resistance ceiling: The $91–$95 region, aligning with moving averages and prior structure, stands as the key level to flip for bullish momentum. Additionally, sustained acceptance above this area may confirm a trend reversal and attract stronger inflows.
The technical picture suggests $SOL is compressing inside a defined range between $75 and $90. Hence, volatility continues to build as price coils near support. This compression often precedes a directional move, either upward expansion or breakdown continuation.
Will Solana Go Up?
Solana’s price outlook depends on how buyers defend the $79 support zone. If buyers maintain control and push above $89–$90, momentum may strengthen toward $95 and $100. Furthermore, increasing inflows and improved sentiment could support a broader recovery phase.
However, failure to hold $79 may trigger renewed selling pressure. Consequently, price could revisit $75 and potentially test $70 in a deeper move. This scenario would confirm continued bearish control within the larger structure.
Related: Cardano Price Prediction: ADA Tests $0.24 As Foundation Reports 45% Asset Drop
For now, $SOL remains in a critical zone. The market continues to show compression, and participants await confirmation. Besides, rising volume and stronger conviction will likely determine the next major trend direction.