The $XRP 30-day liquidity index on Binance has crashed to its lowest level in recent times, making prices more prone to sudden swings.
As $XRP pulls back from the latest lower high of $1.36, liquidity and trading activity have fallen to some of their lowest levels in recent periods, indicating weaker investor participation. This situation now makes the $XRP market more sensitive to price swings.
Key Points
- Amid the recent price pullback, $XRP has begun recording steeper declines in its liquidity index on Binance.
- Data shows the 30-day liquidity index fell to about 0.062 alongside a turnover of roughly $4.46 billion.
- The decline in liquidity means weaker market participation and could lead to sharp price swings.
- Between 2022 and 2024, liquidity exceeded 3, and turnover reached 180-240 billion $XRP, but both began falling from July 2025 onward.
- $XRP has remained in a falling channel since March 18, with resistance at $1.35.
Falling $XRP Liquidity and Turnover Show Weak Interest
CryptoQuant analyst Arab Chain confirmed this in a recent report. According to him, $XRP’s 30-day liquidity index on Binance has dropped to about 0.062, one of the lowest levels in recent times. This means there are fewer buy and sell orders in the market, reducing overall depth compared to periods when liquidity was stronger.
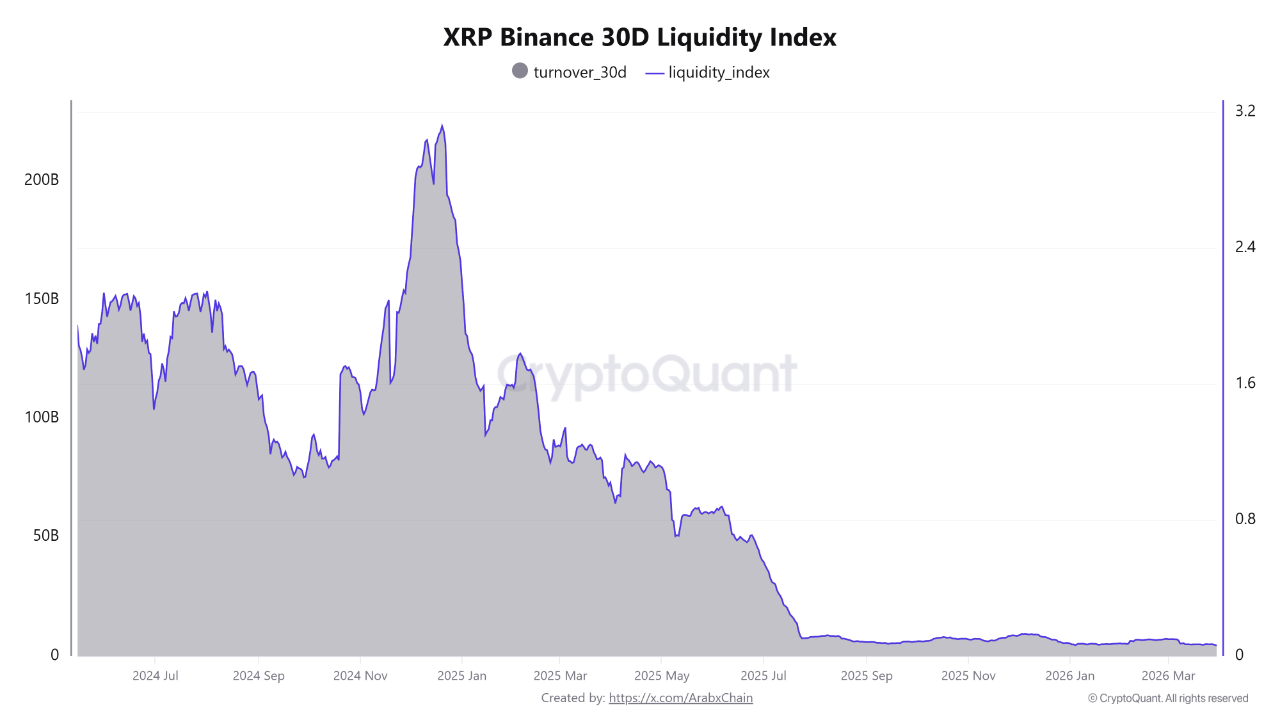
Further, the 30-day turnover index also shows weakness, currently sitting at around $4.46 billion. This is a relatively low figure, confirming the drop in trading activity. According to Arab Chain, both metrics show that large investors and smaller traders are less active in the market right now.
Notably, low liquidity often makes prices more sensitive. When there are fewer orders, even a single large trade can cause a sharp move. At the same time, lower turnover means less money is flowing into the market, which can keep prices stuck or push them lower in the near term.
Historical Data Shows Extent of Decline
Arab Chain had earlier called attention to this trend in a report from early March. As of March 3, $XRP’s turnover rate had already dropped to about 7.02 billion $XRP, while the liquidity index stood near 0.097, which was already considered very low.
This was very different from what the market looked like in the recent past. Specifically, between 2022 and 2024, $XRP saw strong activity on Binance, with the liquidity index rising above 3 at times. During those periods, turnover reached between 180 billion and 240 billion $XRP, showing high trading activity and strong market conditions.
The change began in 2025. From July 2025, turnover started to fall, and the liquidity index dropped below 1. Since then, both measures have continued to decline, reaching the near-zero levels seen today. This steady drop shows that the market has been weakening for a long time.
$XRP Transaction Activity Drops
Meanwhile, transaction data also confirms the decrease in investor interest. Arab Chain recently reported that $XRP activity on Binance has fallen to its lowest level since 2025, with both deposits and withdrawals declining.
In the past 30 days, there were about 310,500 deposit transactions and around 329,400 withdrawals. This leaves a net difference of about -18,900, meaning more funds are leaving the platform than entering it.
However, the bigger concern is that total transaction activity has dropped overall. This shows that the market is slowing down, with fewer participants taking part. It shows a period where traders are less active, and the market is moving with less energy.
Price Trend Stays Weak Despite Slight Relief Signs
The declining investor interest comes amid an obvious weakness in $XRP’s price action over the past few days. Specifically, after rising to $1.36 on April 1, $XRP fell by 2.06% on April 2, continuing a downward trend that began on March 18.
This decline started after $XRP reached $1.6 on March 17 amid the Iran conflict. After the peak, the price began to move within a descending channel, forming lower highs and lower lows. The MACD indicator showed fading green bars after the March 17 high, indicating that buying strength was fading and sellers were taking control.
By March 27, $XRP had dropped below $1.35, and this level has since turned into resistance. Each attempt to move above it, including the push to $1.36 on April 1, has failed and led to another drop.
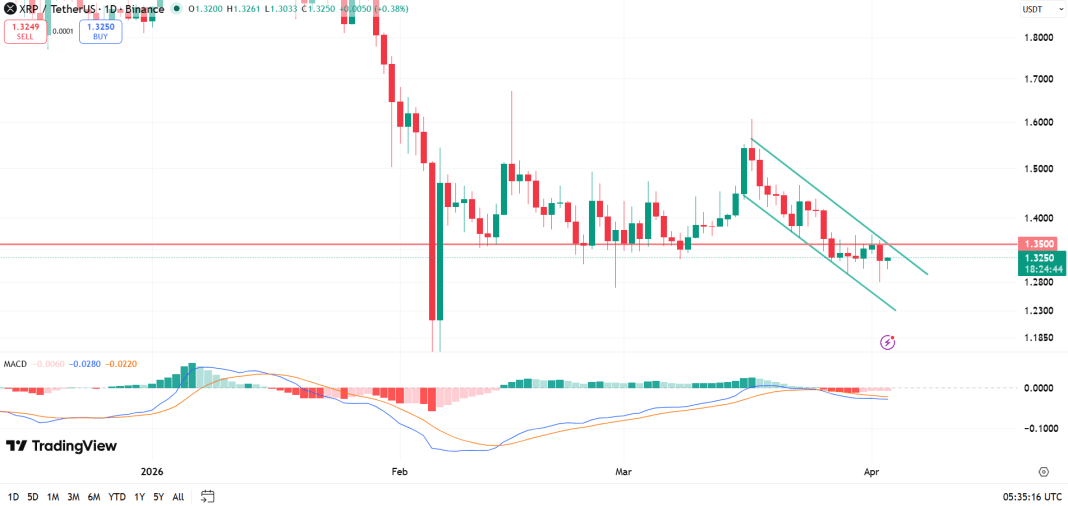
Although the MACD histogram now flashes red, the bars are becoming lighter, which suggests that selling pressure may be easing slightly. However, $XRP needs to move clearly above the $1.35 level to break out of the current downward channel. Until this happens, both the price trend and market data suggest that $XRP remains under pressure.